Getting started
3
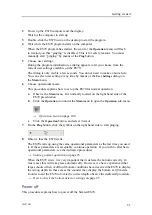
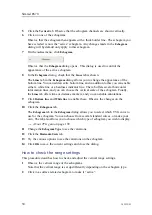
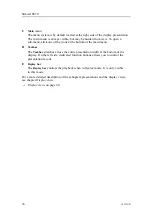
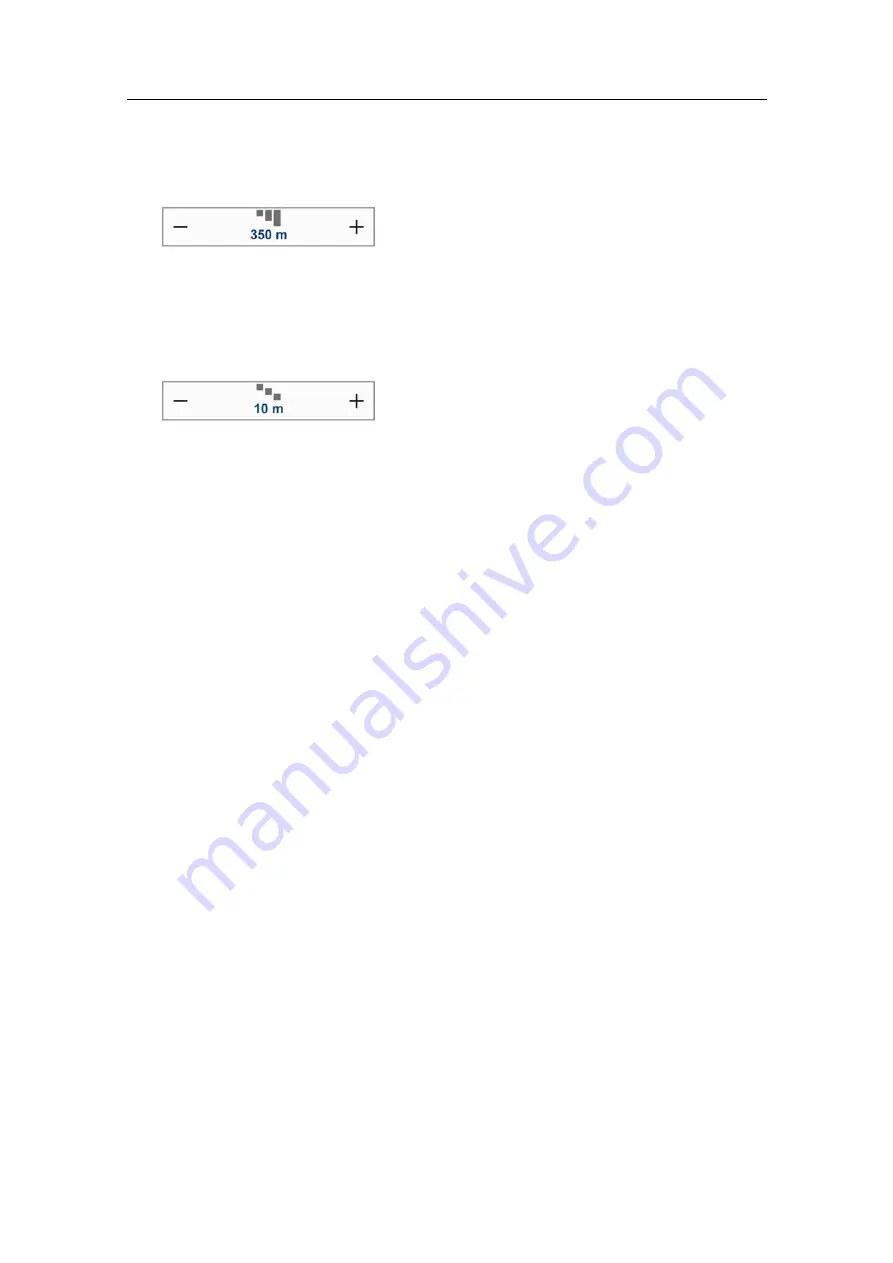
Observe the
Range
button on the
Main
menu.
The
Range
function allows you to specify the vertical range of the water column
covered by the echogram. The range is defined from a selected start range, and
down to a value beneath the current bottom depth. The value shown and selected is
by default applied only to the currently selected echogram.
4
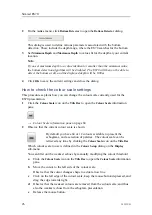
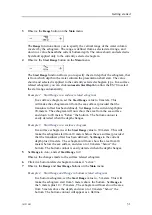
Observe the
Start Range
button on the
Main
menu.
The
Start Range
function allows you to specify the start depth of the echogram, that
is from which depth in the water column the presentation shall start. The value
shown and selected is applied to the currently selected echogram type. In a surface
related echogram, you can click
Automatic Start Depth
to allow the ES70 to select
the start range automatically.
Example 2
Start Range in a surface related echogram
In a surface echogram, set the
Start Range
value to 0 meters. This
will make the echogram start from the sea surface (provided that the
transducer offset has been defined). Set
Range
to the current depth plus
20 meters. The echogram will now show the area from the sea surface
and down to 20 meters “below” the bottom. The bottom contour is
easily detected when the depth changes.
Example 3
Start Range in a surface echogram
In a surface echogram, set the
Start Range
value to 10 meters. This will
make the echogram start from 10 meters below the sea surface (provided
that the transducer offset has been defined). Set
Range
to the current
depth plus 20 meters. The echogram will now show the area from 10
meters below the sea surface, and down to 10 meters “below” the
bottom. The bottom contour is easily detected when the depth changes.
5
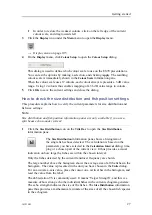
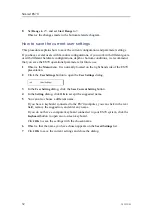
Set
Range
to
Auto
, and set
Start Range
to
0
.
Observe the changes made to the surface related echogram.
6
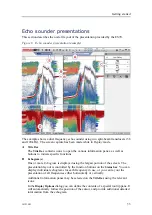
Click in a bottom related echogram to make it “active”.
7
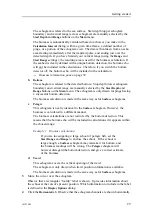
Observe the
Range
and
Start Range
buttons on the
Main
menu.
Example 4
Start Range and Range in bottom related echogram
In a bottom echogram, set the
Start Range
value to –5 meters. This will
make the echogram start from 5 meters above the bottom. Set
Range
to
the 5 meters plus 10 = 15 meters. The echogram will now show the area
from 5 meters above the depth, and down to 10 meters “below” the
bottom. The bottom contour will appear as a flat line.
343539/B
31
Summary of Contents for ES70 - DOWNLOAD AND INSTALLATION REV B
Page 2: ......
Page 128: ...ISBN 13 978 82 8066 118 0 2010 Kongsberg Maritime AS ...

