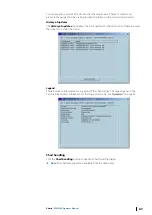
•
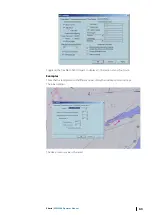
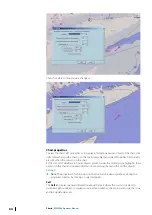
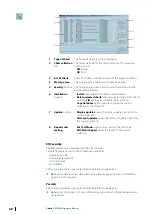
Modify the content and the layout of the chart with the Chart settings dialog(see
•
Select another projection or enter depth values defining the safety limits (see
•
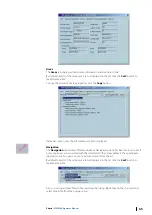
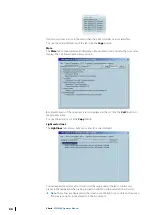
Get more information about the chart and object with the Chart properties dialog (see
•
on page 67) including installation of chart permits
(see
on page 71), checking the last updated objects (see
on page 72), or the update history (see
on page 74). When errors occur
during chart handling a message window displays the type of error.
•
Install and update ENC charts on the Planning station and copy the chart database onto a
remote PC (see
"Multi ECDIS workstations in LAN"
Chart display
Colors and symbols
The implementation of the SENC information display has been done in accordance with IHO
regulations; colors and symbols used are compliant with IHO Special Publication S52
Appendix 2 V3.4 and IEC publication 61174 Annex E.
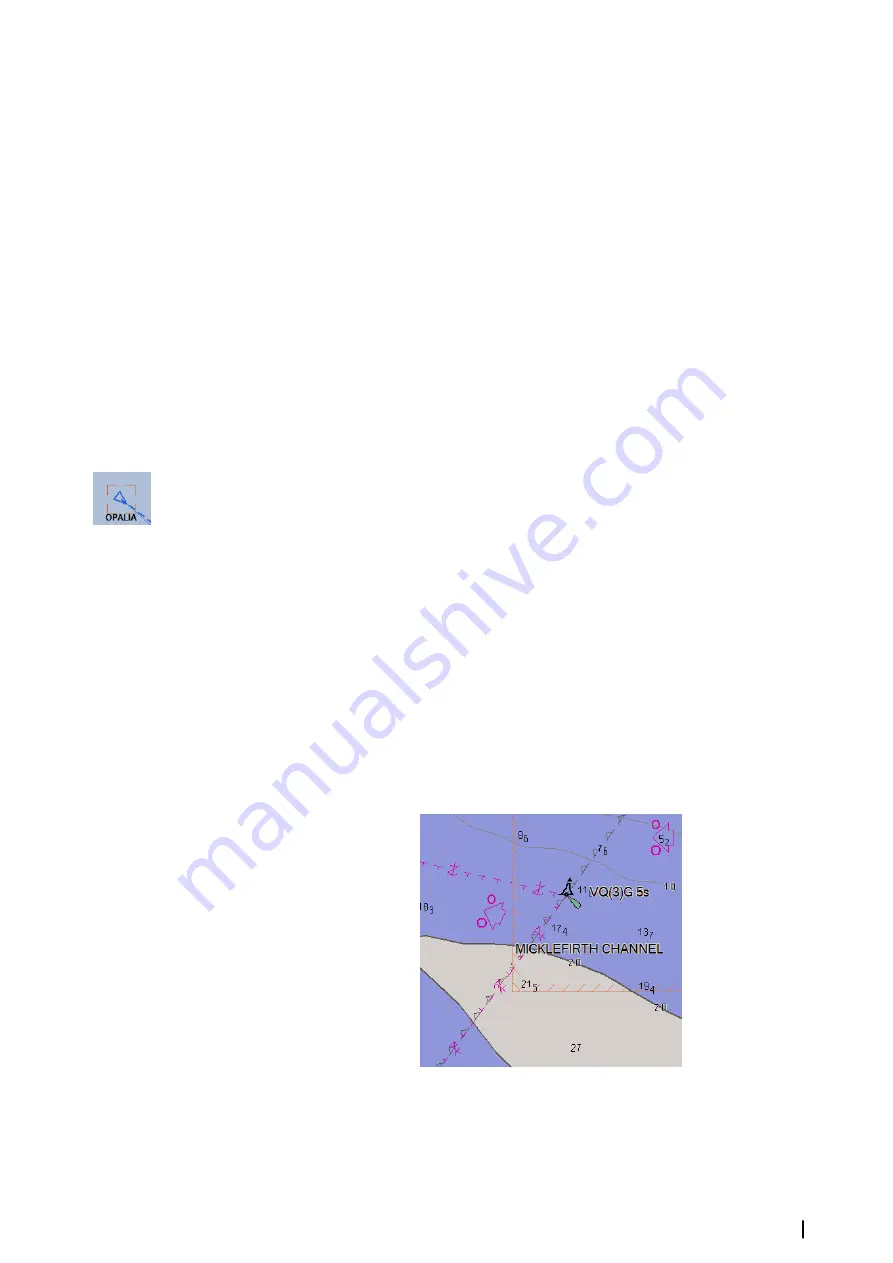
When a symbol is picked, the broken square sign indicate its state.
Course up display mode
ENC may be displayed in two different modes, Course up or North up.
To select the display mode, right click on the chart and check on or off the item menu Course
up. North up symbol is shown in the top left corner of the chart area.
Cells borders
The cell boundaries are displayed on request using the dialog Chart properties. See
A plain grey line or a dashed line is displayed inside the chart boundary: it is the border of the
Administration area. When the display is set to Display base or Standard, the area border is
plain.
ECDIS draws the boundary between navigational purposes (also called Usages). For example,
a boundary is shown around the total outline of all cells that belong to usage Approach.
Non-official data
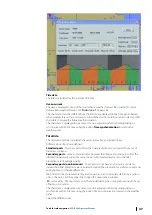
If the chart display contains area with charts that are not official, the area boundary is
indicated with thin red line with zone of diagonal stroke inside the area.
When the non-official chart zone is displayed, the indication
Non-ENC data
appears on the
Legend panel.
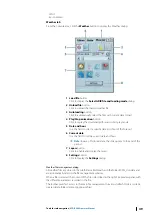
No ENC data
If the chart display contains area with no charts, the area is filled with grey pattern.
Charts
| ECDIS900 Operator Manual
55

