E Q U O B O X R T U - M o d B u s
–
U s e r G u i d e R e v . 2 . 2
S I N A P S I S . r . l . |
V i a d e l l e Q u e r c e 1 1 / 1 3 - 0 6 0 8 3 B A S T I A U M B R A ( P G )
–
I t a l y
T . + 3 9
0 7 5 8 0 1 1 6 0 4
- F . + 3 9
0 7 5 8 0 1 4 6 0 2 |
w w w . s i n a p s i t e c h . i t
i n f o @ s i n a p s i t e c h . i t
27
13.
DATA SAMPLING
13.1
Defining sampling frequency and RAW data
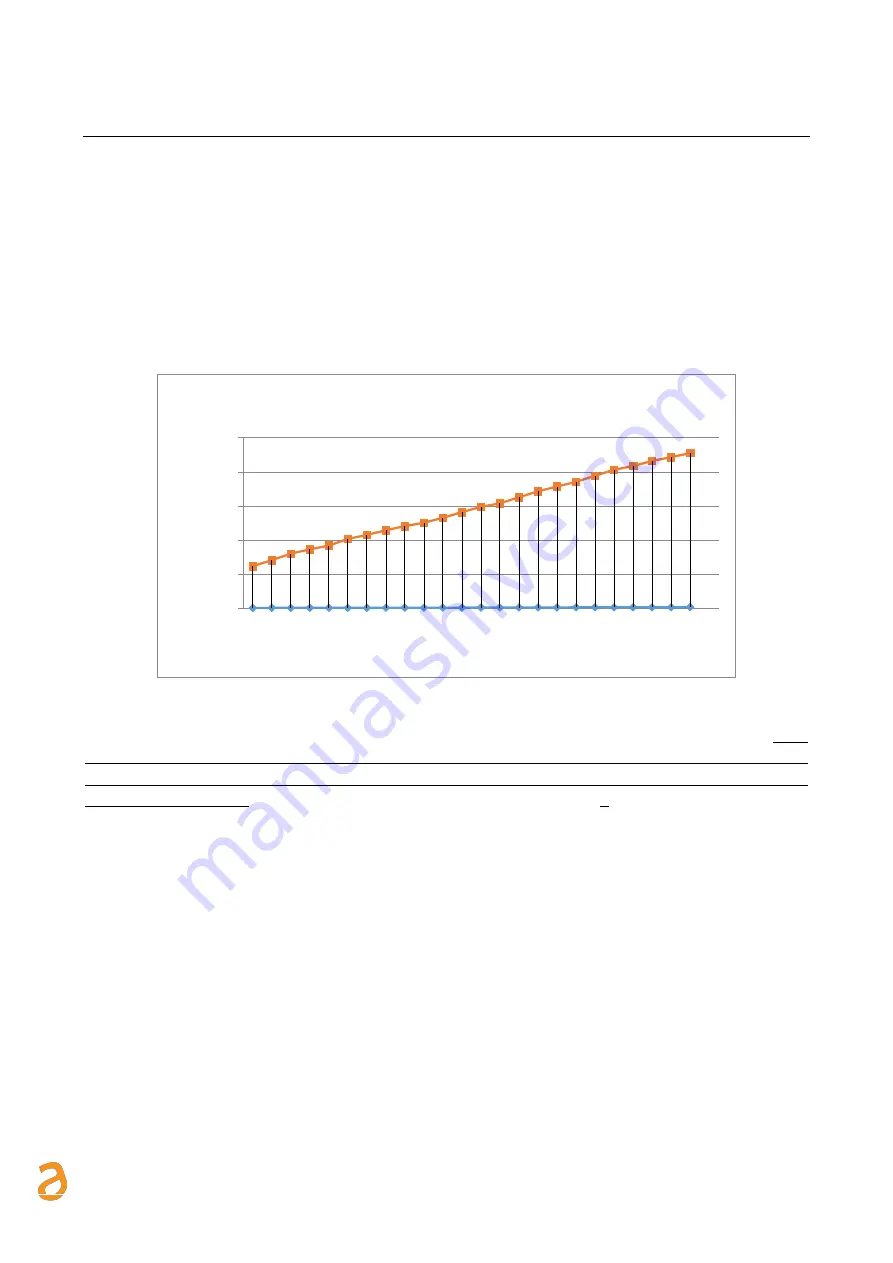
This section analyses how the RTU samples the values. Figure 24 shows a curve sampled with
𝐹
𝐶
= 1 𝑇
𝐶
⁄
equal
to one hour throughout the entire day. The RTU manages five sampling periods, which are:
•
15 minutes
→
96 samples
•
1 hour
→
24 samples (Figure 24)
•
6 hours
→
4 samples
•
12 hours
→
2 samples
•
1 day
→
1 sample
Figure 24 - Sampling
The samples stored in the RTU according to the sampling frequency are defined as RAW samples.
RAW
samples will always refer to the consulted day and you can store up to 96 samples for every day of the
year for 60 devices. The samples of the previous year will be cyclically deleted from the RTU mass
memory (Ref. Chapter
Errore. L'origine riferimento non è stata trovata.
).
Give special attention to the
devices documentation before start the sampling frequency RT. If the sampling value is too high, it can cause:
•
no response from the devices in the field following the exhaustion of the possible responses from the
unit.
•
early device battery depletion compared to that declared in the datasheet
0
1000
2000
3000
4000
5000
1 2 3 4 5 6 7 8 9 10 11 12 13 14 15 16 17 18 19 20 21 22 23 24 25
M
ag
n
itu
d
e
sam
p
le
d
Time axis
Sampling


