E Q U O B O X R T U - M o d B u s
–
U s e r G u i d e R e v . 2 . 2
S I N A P S I S . r . l . |
V i a d e l l e Q u e r c e 1 1 / 1 3 - 0 6 0 8 3 B A S T I A U M B R A ( P G )
–
I t a l y
T . + 3 9
0 7 5 8 0 1 1 6 0 4
- F . + 3 9
0 7 5 8 0 1 4 6 0 2 |
w w w . s i n a p s i t e c h . i t
i n f o @ s i n a p s i t e c h . i t
28
14.
DEFINING SUMMARY DATA
To follow will be given the definition of the data generated dall'RTU Summary in relation to Figure 24.
The RTU
manages four types of summary data for a maximum of 10 years for 60 devices
. Regardless of the choice
of the given phase synthesis configuration, the RTU generates all four values of synthesis (Cap. 15) so that the
variation of the data in during the work change all the historical data yet generated.
Changing the type of
summary data during the work involves the regeneration of all of the historical data already generated
by RTU
. The summary data are managed
•
None: no data displayed
•
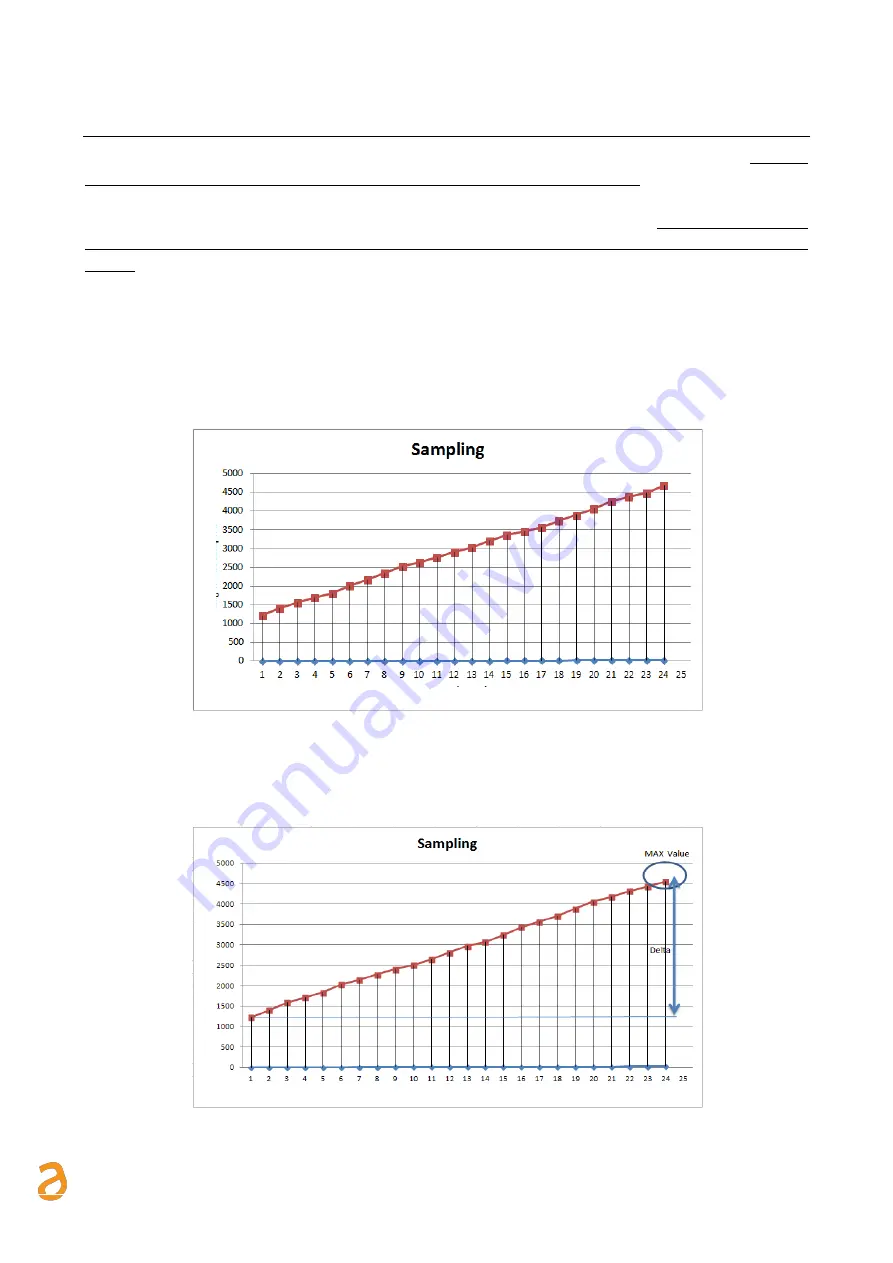
Consumption: generates data as the maximum value at the end of the day and corresponding delta
•
Minimum: generates data as the minimum value of the day
•
Maximum: generates data as the maximum value of the day
14.1
Summary Data
–
None
No summary data displayed in relation to the sampled data
Figure 25 - Summary Data
–
None
14.2
Summary Data
–
Consumption
Summary data related to Consumption provide the maximum value logged during the day and the delta during
the day
Figure 26 - Summary data - Consumption
Sa
mple
d
V
al
ue
Time axis
Sa
mple
d
V
al
ue
Time axis


