C
ONTENT
Sinar arTec Operating Instruction V 1.00
28
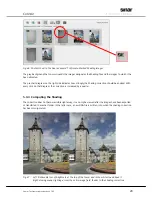
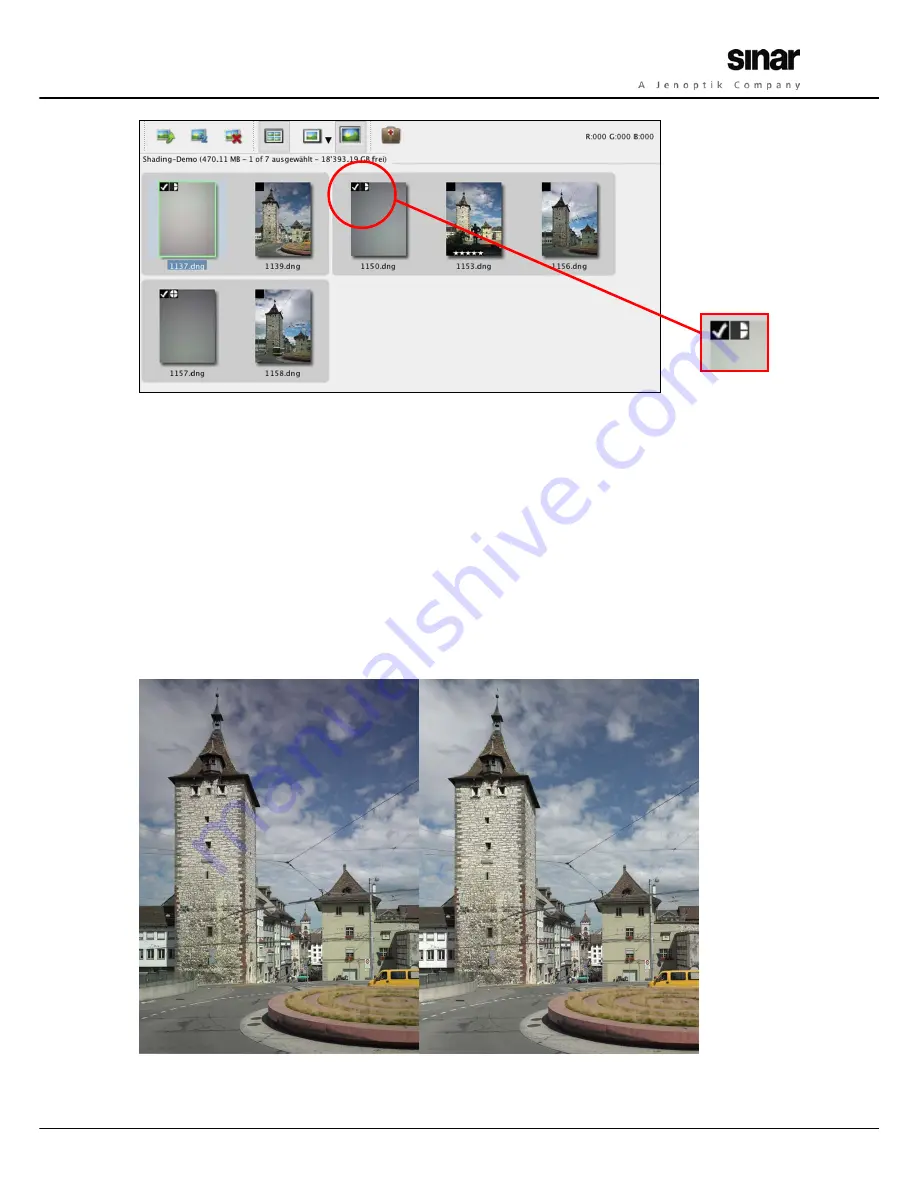
Fig. 46: Contact sheet in the Sinar eXposure™ software
:
Marked Shading images
The gray background that now surrounds the images designates the Shading file and the images to which it ha
been allocated.
The pie chart diagram on the right side indicates how strongly the Shading correction should be applied. With
every click on that diagram, the correction is increased by a quarter.
5.3.3 Computing the Shading
The correction does not become visible right away, it can only be viewed after the images have been exported
or transferred to another folder. In the latter case, a new DNG file is written, into which the shading correction
has been incorporated.
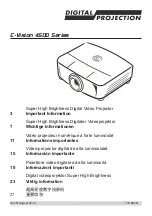
Fig. 47: Left: Noticeable loss of brightness at the top of the tower and in the white cloud above it.
Right: Homogeneous lighting across the entire image field, thanks to the Shading correction.

