Frequency Response Function Module
Recording the Measurement
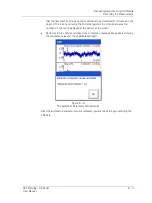
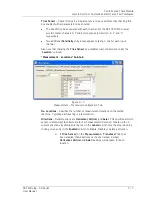
Figure 8 - 8.
Verify Acquired Data.
•
Review the FRF data and either
Accept
or
Reject
the hit.
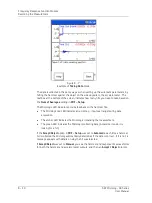
When all
the averages are taken, the
Taking Data
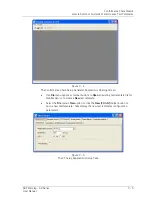
screen updates to show the FRF
magnitude / phase traces. The text box at the bottom of the screen indicates how many
hits were taken.
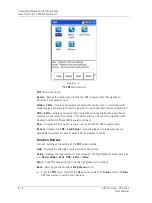
Figure 8 - 9.
The
Taking Data
Screen – Final FRF.
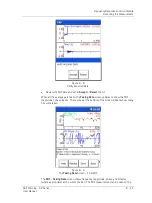
The
FRF - Taking Data
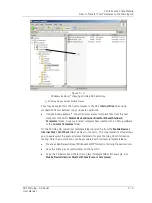
screen shows frequency, magnitude, phase, and Q factor
(where appropriate) at the cursor position. The FRF measurement can be seen on the
SKF Microlog - GX Series
8 - 11
User Manual


