' SLS loudspeakers Inc., 2002. All rights reserved.
14
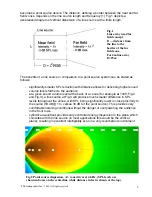
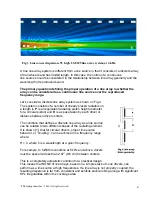
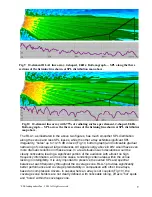
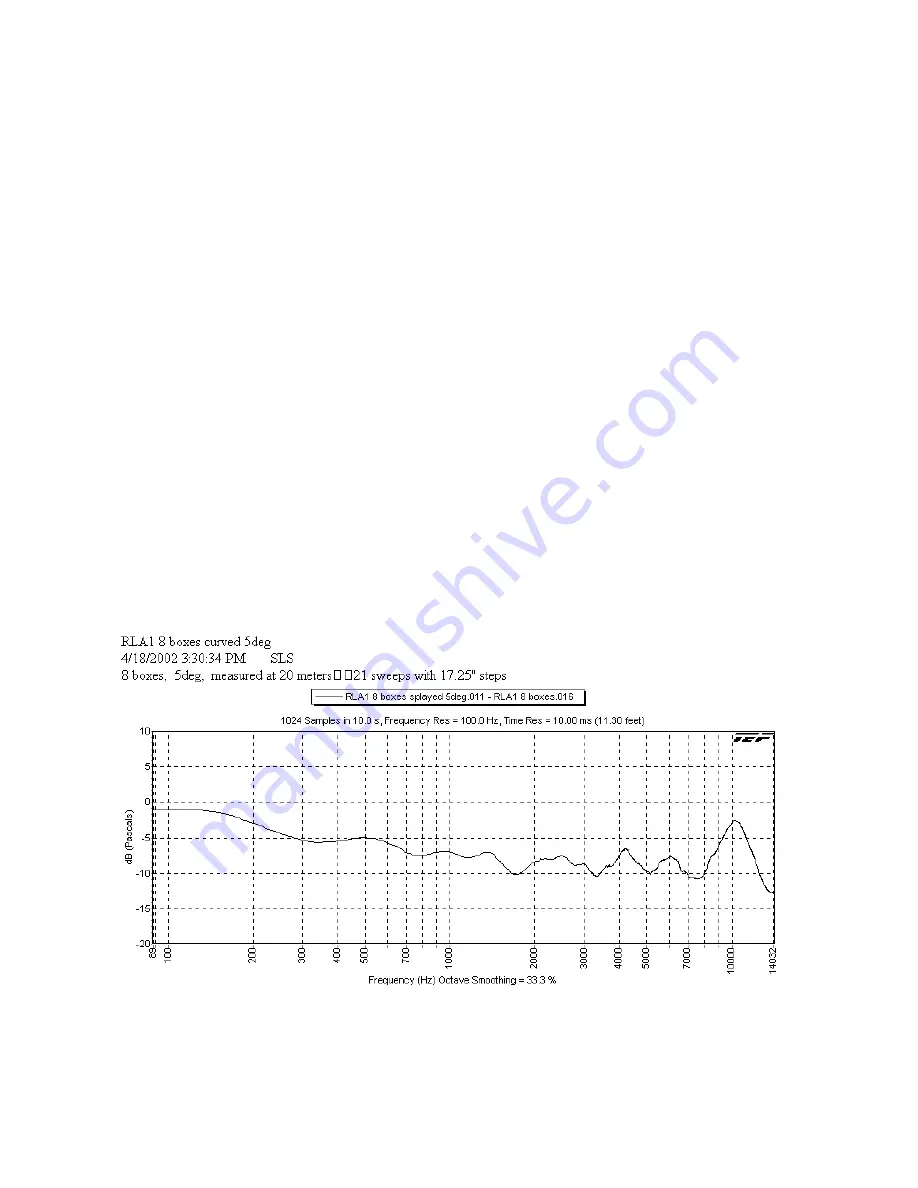
Fig. 18 SPL difference between straight (0
°
splay) and curved (5
°
splay between elements) 8-
element RLA1 line array.
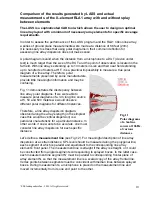
The straight RLA1 (0
°
splay) demonstrates very good coverage consistency
±
4dB
throughout the entire measured spectrum. The two bottom lines indicate the border (-6dB)
of the array’s coverage zone, coinciding with the ends of the measurement line. The
8–element RLA-1 dispersion control starts from 500Hz. Below 500 Hz the array gradually
loses its line source properties and begins to resemble a point source device below
200Hz.
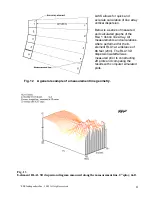
The RLA1, consisting of 8 splayed elements, has a significantly lower point of dispersion
control, down to 200 Hz, due to the larger size of the array’s frontal line dimension. The
lowest curve on the graph indicates the end point of the coverage zone. The response is
remarkably consistent and smooth within the main portion of the coverage up to 5 kHz,
with some deviations above this point.
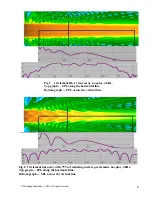
Fig.18 depicts another interesting and very useful relationship: the difference between
measured frequency response of the straight RLA1 and the curved RLA1 with 5
°
splay
between each element. The microphone was placed in the middle of the coverage zone,
on symmetry axis, at 66 feet (20m). When elements of the array are splayed, the output is
significantly lower than the output of the same array with no splay between boxes.
An average - 8dB loss above the dispersion control point of 200Hz is the result of
spreading the energy over much wider coverage zone. This result points to the fact that
straight and splayed line arrays will have a different spectral balance and may have to be
equalized differently.
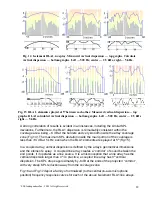
The LASS program allows for frequency response prediction throughout a venue with a
reference point having equalized response. Normally, the reference point is set at FOH
(front of house) mixing position.


