Chapter 4. Spectrum Tab
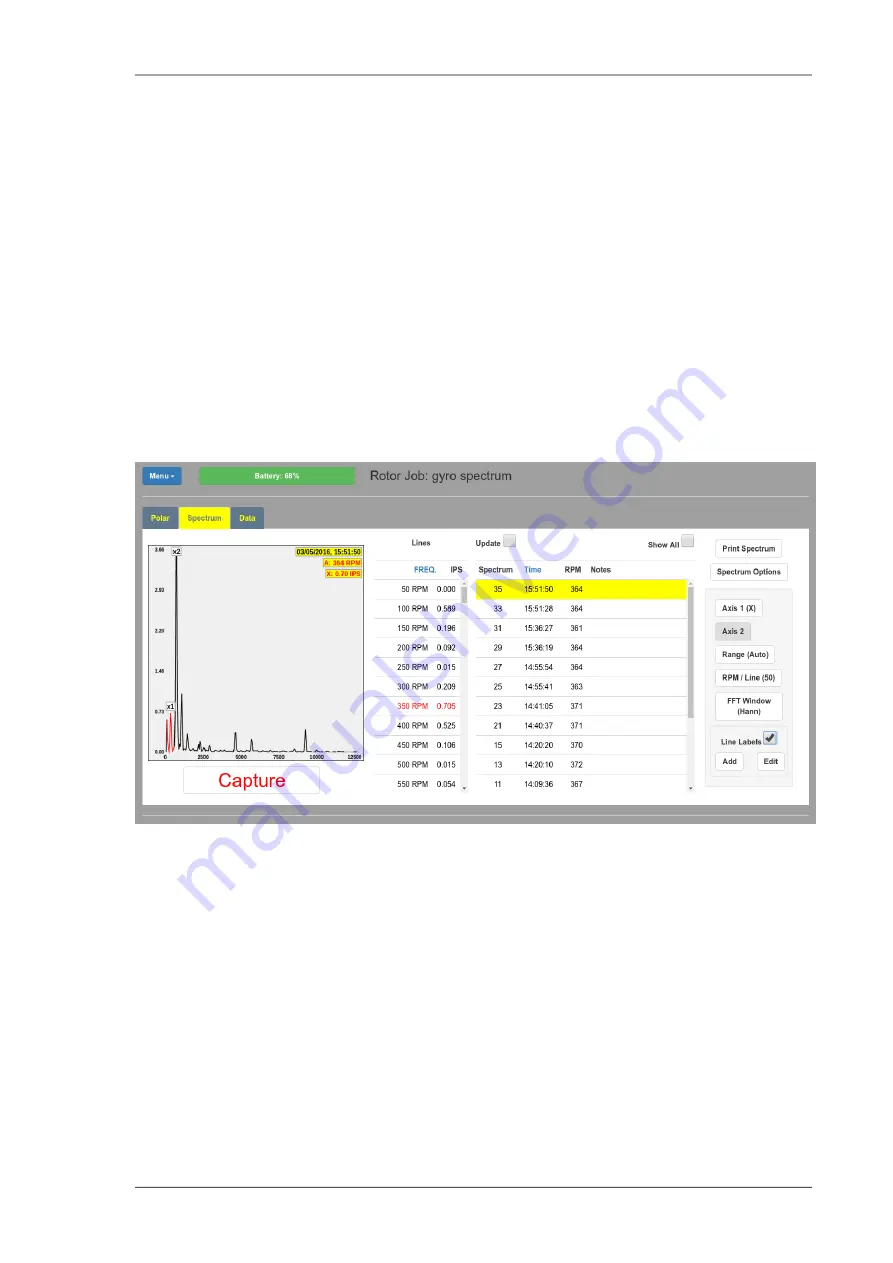
The spectrum tab displays the vibration spectrum. Vibration level (IPS) is
plotted against RPM. The displayed spectrum may either be the live data
coming from the PB-4 or a previously captured spectrum. The spectrum is
plotted as a curve by joining the tops of the
spectral lines
1
. Each spectral line
provides the IPS value for a specific RPM (e.g. 100, 200, 300, etc.). The
spectrum may be panned and zoomed
2
.
The spectrum display is extremely useful for helping to diagnose vibration
problems as it allows you to determine how much vibration is occurring at
each of the frequencies of interest (prop/rotor frequency, blade pass
frequency
3
, engine crank and half-crank frequencies, etc.)
Here we see the spectrum tab displaying a previously captured spectrum.
Fig 4.1. Spectrum tab (with options visible)
The spectrum tab contains (from left to right, top to bottom):
4.1. Spectrum display
The spectrum display shows vibration level (in IPS) plotted against RPM. If
the PB-4 is connected and the Update checkbox is checked, the display will
be continuously updated to show the latest spectrum received from the PB-4.
The Axis 1 menu (see below) controls which axis the displayed spectrum is
sourced from.
1
The spectral lines are not actually shown in the display.
2
Pinch-zooming is supported for touch screens and mouse-wheel zooming for laptops, etc.
3
Blade pass frequency is the prop/rotor frequency × number of blades.
29
www.smartavionics.com
Summary of Contents for PB-4
Page 6: ...www smartavionics com vi...
Page 12: ...www smartavionics com 6...
Page 20: ...www smartavionics com 14...
Page 34: ...www smartavionics com 28...
Page 40: ...www smartavionics com 34...
Page 56: ...www smartavionics com 50...
Page 62: ...www smartavionics com 56...
Page 68: ...www smartavionics com 62...
Page 70: ...www smartavionics com 64...
Page 74: ...www smartavionics com 68...
Page 78: ...www smartavionics com 72...


