User Manual - twentynine
8.1
Image Statistics
8.1.1
Histogram
A histogram is a graphical representation of the distribution of all intensity values that can be found in an
image. The histogram graph is plotted using the Cartesian coordinate system. The x-coordinates are in
a range from 0 to 2
n
- 1, where n is the bit depth of a pixel value. Each x-coordinate can correspond
to an intensity value that exists in the image. The y-coordinates are in a range from 0 to
image_width
x
image_height
, describing the total numbers of pixels for each pixel value found in the image.
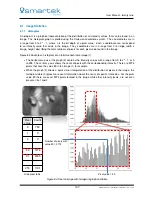
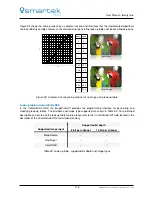
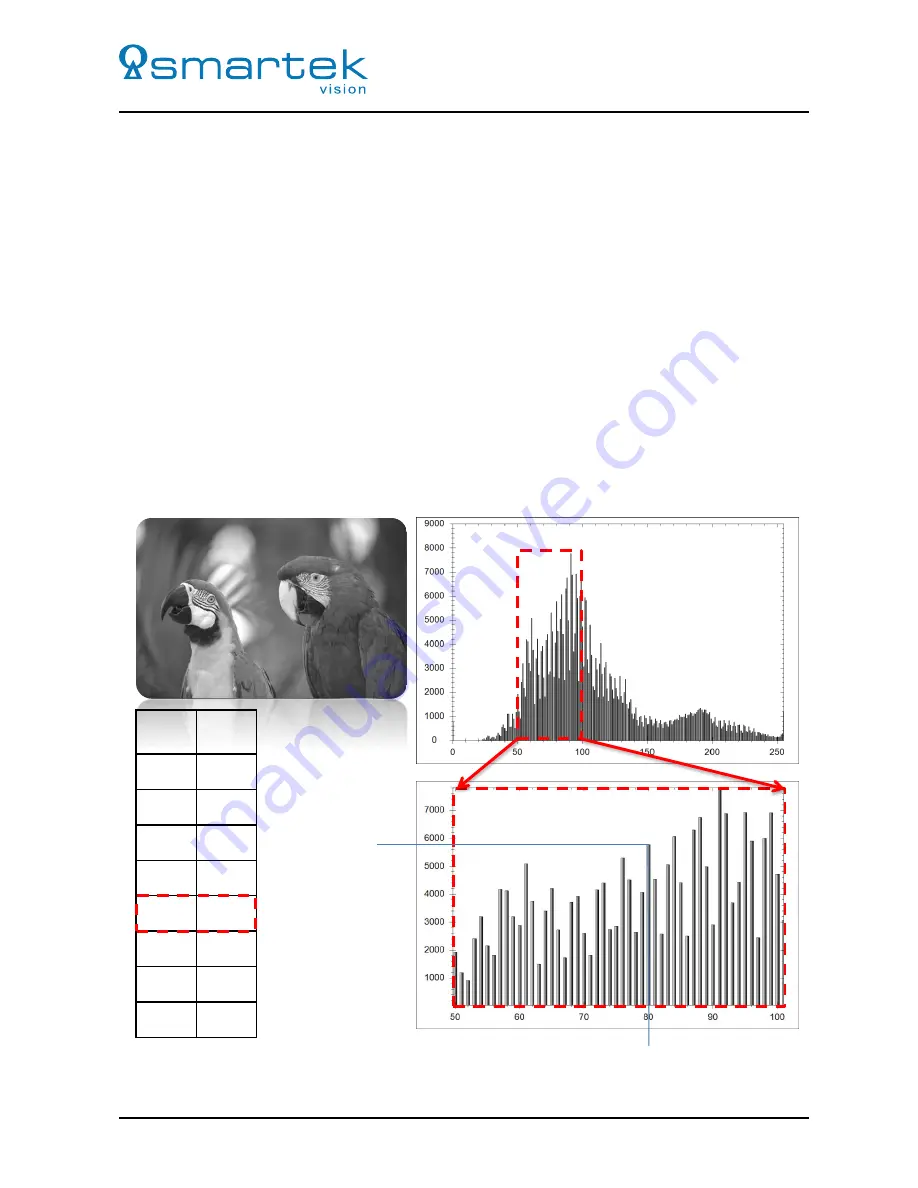
Figure 84 illustrates a histogram of an 8-bit monochrome image (1):
•
The horizontal x-axis of the graph (2) contains the intensity values with a range from 0 to 2
8
- 1, or 0
to 255. The vertical y-axis shows the count of pixels with the corresponding intensity. There are 5774
pixels that have the value 80 in the image (1) for example.
•
While the graph (2) allows a quick visual interpretation of the distribution of pixels in the image, the
histogram table (3) gives more exact information about the count of specific intensities. For the pixel
value 80 there are exact 5774 pixels located in the image while other intensity levels, are not even
present, like 1 and 2.
Pixel value = 80
Number of pixels with
value 80 = 5774
Pixel
value
Count
0
768
1
0
2
0
…
…
80
5774
81
4535
…
…
255
1191
Histogram table
Figure 84: Source image with histogram graph and table
107
SMARTEK Vision | User Manual - twentynine | Doc. v1.0.2

