PowerForce
–
User Manual
Radlabor GmbH | Heinrich-von-Stephan-Str. 5c | 79100 Freiburg | Germany
www.smartfit.bike | www.radlabor.de
Index tab cycle plot
The cycle plot window plots circular forces. An additional curve shows the summation of both force
signals.
Above the cycle plots you see different index tabs:
The
power
tab shows you the generated power of the left and the right leg, as well as their
summation.
In the
settings
, you can set the start angle, the crank length and the used data pieces.
Index tab Wireless
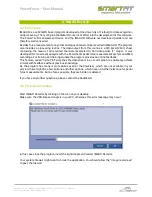
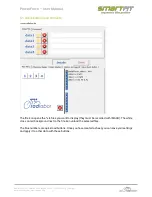
Before you start the measurement, it is recommended to check the wireless-connection of your
PowerForce system. So, you have an overview about the current wireless signals in [V], the base
station receives.
Under the wireless signals you see an overview about the arriving frequency samples. Usually they
are about 500 Hz (1). When you just turned on the System it takes a few seconds until the transmitter
is booted and the maximum sample frequency is reached.
Further you see a button for manual time correction and an overview about the number of connection
interrupts.


