background image


PowerForce 

 User Manual 

Radlabor GmbH | Heinrich-von-Stephan-Str. 5c | 79100 Freiburg | Germany 
www.smartfit.bike | www.radlabor.de 


4.4 Measurement 

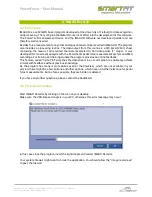
To start pedal force measurements, click the “measure” button. 


A  pop  up  window  will  open  where  filename  and  information  about  the  trial  can  be  entered.  All 

channels defined and marked green in the “channel definition instrument” are listed in this window. 

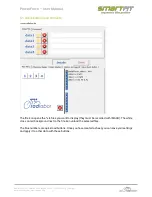
A second selection which channels you want to record must be made. Select the trigger and all four 
force channels by marking them green. After continuing a red line will run across the screen writing 
and overwriting the recorded values in the graph. If you click on the Cycle Plot register and start 
pedaling,  red  circles  can  be  seen.  These  circles  display  the  current  forces  relative  to  a  black 
reference circle. The black circle is the zero line. The further the red line is outside the circle, the 
bigger is the force. The further it is inside, the bigger is the measured negative force. The displayed 
channels can be changed above the charts.  


The power calculations depend on the crank length, which has to be entered below the cycle plot 
window. If the Trigger is not installed at the top dead center of the right crank arm, the offset can be 
entered as well.  
  

To start data recording click the “RECORD” button. You can pause data recording by clicking this 

button again and f

inish the trial with “STOP”. While recording the “RECORD” button is green

 and a 

timer depicts the seconds written.  
 

As  soon  as  you  press  the  “STOP”  button,  the  program  will  as

k  you  if  you  want  to  start  Online 

processing. If you confirm, a second window will open and ask, which data you want to include for 
your results. This is a control routine, which compares the length of data pieces between two trigger 
signals to the average length. The tolerance interval is +/- 20% of the average signal length. If you 
have no accelerated movement, there should not be more than one or two signals, which vary. This 
is usually the last signal, because recording stops at most times less than one revolution after the 
last trigger signal. 


Summary of Contents for PowerForce

Page 1: ...PowerForce User Manual Radlabor GmbH Heinrich von Stephan Str 5c 79100 Freiburg Germany www smartfit bike www radlabor de PowerForce System User manual wireless edition ...
Page 2: ... unpacking 8 2 1 components 8 2 2 Mounting 9 3 Software Installation 12 3 1 Install NI DAQmx Driver 12 3 2 Install NI LabVIEW 2009 Runtime Engine Library 12 3 3 Install IMAGO Records 12 4 IMAGO Record 13 4 1 Introduction 13 4 2 First start and setup 13 4 2 1 Load Setup files 14 4 2 2 Set save and load calibration values 15 4 3 Description of IMAGO 17 4 3 1 Main Menu 17 4 3 2 Index Tab 18 4 4 Measu...

Page 3: ...itter unit or the connection box the warranty is no longer valid Never clean the sensor or the transmitter unit with water or use it in wet conditions Do not cramp the position switch it is sensitive for pressure Check before each ride that the sensors and the pedals are fixed properly When unplugging any connection always pull straight down rather than sideways or you could damage connector pins ...

Page 4: ...rerequisite to analyze cycling performance capability from a biomechanical point of view The question is not why to measure pedal forces but how to do it Comparing other existing instruments whose purpose is the determination of divers mechanical parameters concerning cycling propulsion there are some methodological or practical limitations regarding the requirements of either a biomechanical lab ...

Page 5: ...e based on Fr Fe effective tangential force Fe is the component of Fr which lies in moving direction of the crank pedal which is a circle Therefore the vector of Fe is always tangential to this circle or perpendicular to the crank Fe is responsible for the propulsion but only if it is aligned forward with the rotating direction If it is aligned backward e g if a rider does not pull up the pedal in...

Page 6: ...nk The system determines the magnetic field variations Hall Effect because of the angular displacement 1 1000mm of a small magnet in respect to a sensor Due to the specific circular construction of the force transmitting elements the applied force can be divided into a radial and a tangential part Positive tangential force FT Fe is in the pedaling direction and positive radial force FR Fu is in th...

Page 7: ... Data Wireless edition Mass of single sensor including radio 370 g Mass of receiver 116 g Measurement range 500 up to 1500 N Breaking load 3000 N Sampling frequency pedal force 500 Hz Wireless band ISM Band 2 4 GHz Transmission distance Indoor 3 5 m Outdoor 2 3 m Battery Type NiCd 800 mAh Time for continual use 6 8 h Resolution 12 Bit ...

Page 8: ...rts with highest care 2 1 components Check the content inside the suitcase 1 2x PowerForce sensor left right with mounted transmitter Accumulator included two protector caps mounted 2 1x Base station receiver 3 1x Adjustment Tool 4 2x adjustment tools screws 5 2x crank sensor screws 6 2x Accumulator Charger 7 1x Serial USB cable Base station to PC 8 1x USB License Dongle 9 1x 10mm Allen Key 10 1x ...

Page 9: ...w smartfit bike www radlabor de 2 2 Mounting To improve the measurement it is important to fix the sensor in appropriate position on the ankle Before the mounting make sure that the adjustment screws are screwed out so that the sensor has some space to move Then mount the sensor on the crank ...

Page 10: ...many www smartfit bike www radlabor de Adjust the apex on the cone bolt Put the little bolts in the middle and fix the adjustment tool hand tight onto sensor by using the corresponding screw for each site Put the cone of the adjustment tool into the center of the bottom bracket screw ...

Page 11: ...ustment screws Tighten the screws alternating It means first a little the left then a little the right until the screws fixing the sensor in position Make sure that the cone of the adjustment tool stays in the center of the bottom bracket screw After the adjustment screws fixing the sensor tight the sensor crank screw Then you can take off the adjustment tool ...

Page 12: ...nstall the NI DAQmx Driver Click on the icon in the saved file and follow the setup instructions The Installation will take some minutes 3 2 Install NI LabVIEW 2009 Runtime Engine Library After installing the DAQmx Driver you must install the NI LabVIEW Runtime Engine This library is necessary to read out the data from IMAGO Click on the icon and follow the setup instructions The Installation will...

Page 13: ... PowerTec pedal force measurement system and EMG recordings For training and training studies the program provides an online feedback This feature called Cycle Plot simplifies the data stream in a circular graph to enable any athlete to work with feedback without previous knowledge As the program has many more features used at the University which are not available in your version there might be a...

Page 14: ...main record window IMAGO record vi and a window with the overview of all channels Wireless Cycling Instrument vi 4 2 1 Load Setup files To load the optimum setup files you must click on setup Find the folder record on the following data path Then you can insert the downloaded setup file called RECORD_CYCLE1 set After this step the optimal set up settings should be present in IMAGO ...

Page 15: ...u can see the offset settings and the correction values that were determined during the calibration of your system in the Radlabor Company Now enter the for your system individual parameters in the Wireless Cycling Instrument VI as seen in the picture Note that the gain for the power channels must be calculated with 500 𝑁 𝑉 to get from the voltage in V to the force in N Then press on the save butt...

Page 16: ...t bike www radlabor de To have these settings at each start of IMAGO you need these set files loaded in the Read Write Global Variables VI You find this VI under the path Options Extras Paths Then you must load the set files as shown in the picture After these adjustments your system is ready to use ...

Page 17: ...y To stop this automatism you need to switch the Always Active option Further here is the setting the page and for printing the actual window Beenden means to close IMAGO Tools Via the Tab Tools you can do the Binary Export You need this binary export to transform your binary data in an excel readable file format e g for analyzing the separated force channels or the acceleration channels Extras He...

Page 18: ...elp Via the Help tab you have three selection possibilities If you select WOZU KONTEXTHILFE If you select About IMAGO you can check which version of IMAGO you have Further you can see the key number of your USB license dongle Under User Manual you can call up further usage instructions for IMAGO Records To this your PC must be connected to the internet 4 3 2 Index Tab Via the Index Tab you can cho...

Page 19: ... start angle the crank length and the used data pieces Index tab Wireless Before you start the measurement it is recommended to check the wireless connection of your PowerForce system So you have an overview about the current wireless signals in V the base station receives Under the wireless signals you see an overview about the arriving frequency samples Usually they are about 500 Hz 1 When you j...

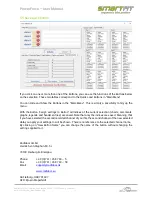
Page 20: ...H Heinrich von Stephan Str 5c 79100 Freiburg Germany www smartfit bike www radlabor de If you notice a high increasing number of interrupts it may occur because of an interference of your Wi Fi Signal or a damage on the transmitter unit ...

Page 21: ...the bigger is the measured negative force The displayed channels can be changed above the charts The power calculations depend on the crank length which has to be entered below the cycle plot window If the Trigger is not installed at the top dead center of the right crank arm the offset can be entered as well To start data recording click the RECORD button You can pause data recording by clicking ...

Page 22: ...007 but an older Excel 2003 Version is also available which is containing less functions The Tool is written in Visual Basic for Applications When you open CyclePlotAssistant xltm the first step you need to take is to activate Macros for this Workbook You start the CyclePlotAssistent by click on the Icon Make sure that the macro files are in the same folder as the application So its recommended to...

Page 23: ...f CPA you see different icons If you click on Main_Menu you can open the menu By clicking on the arrows above Zero circle you can change the size of the zero circle for cycle and vector plots It Has no relevance for other charts In the box of graph size you can change between maximal amplitude for all graphs or the same proportion standard ...

Page 24: ... buttons and contents The file icon opens the xls files you want to display they must be recorded with IMAGO The white cross on red background next to the file icon unload the selected files The blue numbers are quick load buttons Once you have created a sheet you can save your settings and apply it to other data with these buttons ...

Page 25: ...is divided into six areas where charts can be plotted There are also description fields available If you click on Corner Caption or Header you can arrange the header and the headline of the print sheet The information is taken from the loaded raw data files Multiple choices are impossible Cycle In this chart the data is plotted in a circle The black circle is zero Positive data is outside the blac...

Page 26: ...position Note that the first coordinate is always the direction of Fe the second always that of Fu Two different channel pairs can be shown in one graph XY Graph 5 3 Graph Selection Here you can see which file is represented by data1 data2 data3 and data4 The button details open the detail window This appears in the right part of this window and all selected graphs are shown there To create new Qu...

Page 27: ...one chart 5 4 Caption and legend Add manually Comments which can be added to the header label or legend 1 Similar to the overview for the graph selection an overview window for the top bar and legend labels exists The left list represents the Top bar selection the right one the legend selection Multiple choices are possible 2 By clicking on the chart position you can apply a name to the Chart in t...

Page 28: ...on all Indices of the current selection charts comments graphs legends and header entries are saved Note that only the indices are saved Meaning that if you have selected the second recorded channel of your file the second channel of the new selected data you apply your settings to will be shown There is no reference to the selected channel name By clicking on New Button Name you can change the na...

Reviews: