41
Scanner Operations
Operations
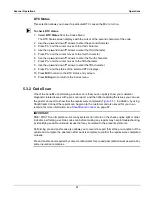
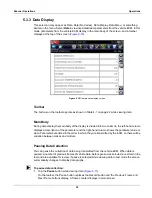
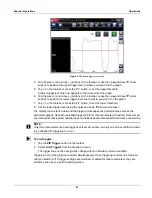
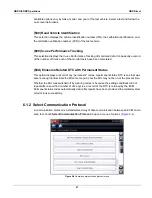
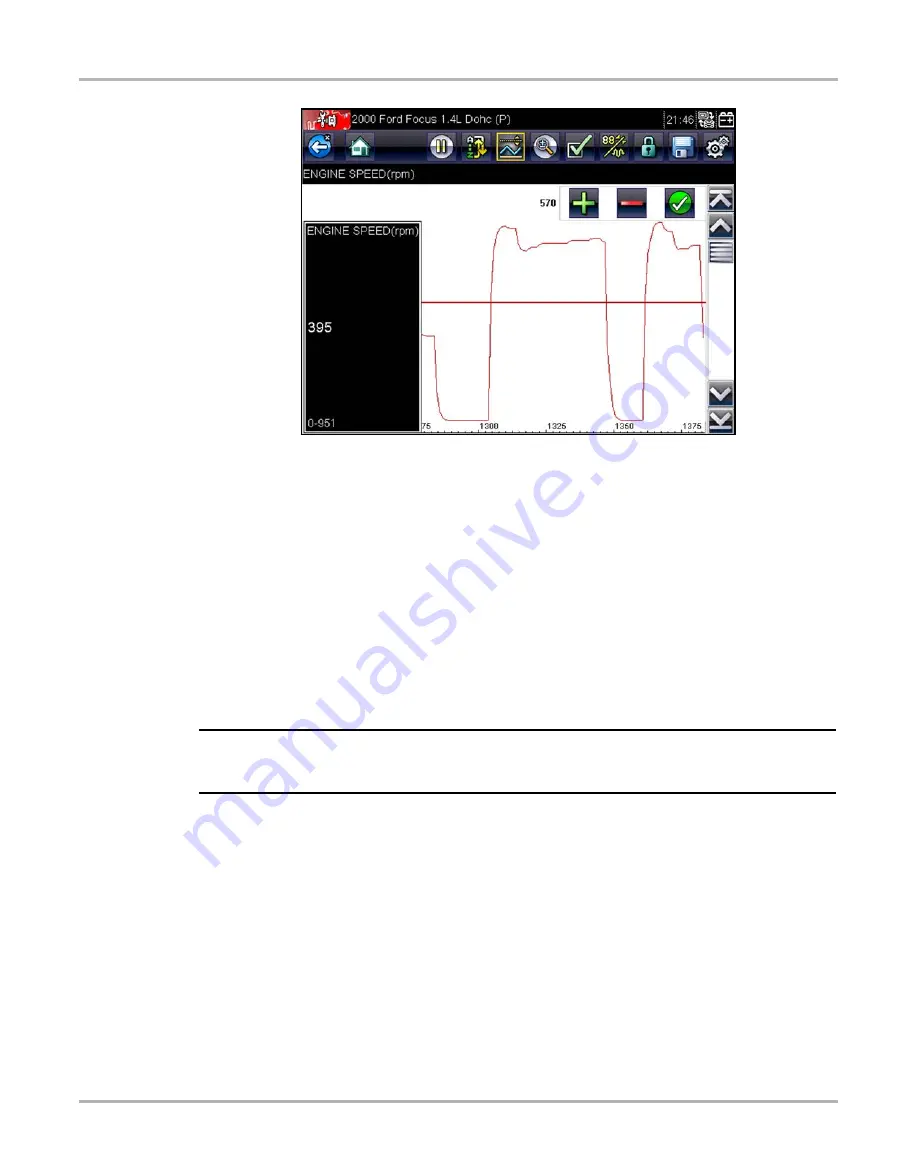
Figure 5-14
Sample trigger set screen
4. Tap the plus (+) and minus (–) buttons on the toolbar, or use the up
b
and down
d
arrow
buttons to position the upper trigger level to where you want it on the graph.
5. Tap
a
on the toolbar, or press the
Y/
a
button, to set the upper threshold.
A lower trigger level line now appears at the mid-point of the graph.
6. Tap the plus (
+
) and minus (
–
) buttons on the toolbar, or use the up
b
and down
d
arrow
buttons to position the lower trigger level line to where you want it on the graph.
7. Tap
a
on the toolbar, or press the
Y/
a
button, to set the lower threshold.
8. Set the lower trigger level using the up
b
and down
d
arrows and press
a
.
The display returns to live data and the trigger points appear as horizontal lines across the
parameter graphs. Repeat to establish trigger points for other parameters if desired. Once armed,
any data points that register outside the set conditions pause data collection and save a recording.
NOTE:
i
Only three parameters can have trigger levels set at one time, but only one of the conditions needs
to be satisfied for triggering to occur.
z
To arm triggers:
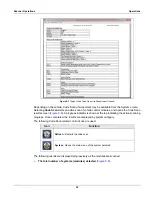
1. Tap the
PID Trigger
button on the toolbar.
2. Select
Arm Triggers
from the dropdown menu.
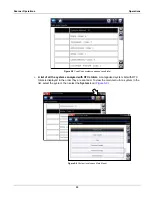
The trigger lines on the data graphs change color to indicate an armed condition.
Triggers for all of the graphs are armed simultaneously. Once triggering is armed it remains so
until you switch it off. If trigger settings are modified, or added for other parameters, they are
armed as soon as you exit the setting screen.

