39
6. Evaluation of measurement results
The Body Balance will determine your individual ideal condition in regard to body weight and body fat content
based on your personal data and the recommendations of health experts.
It will furthermore determine the total water content and muscle content. Please note that muscles also contain
body water, which is already taken into consideration in the body water analysis. Therefore, the total calculation will
always result in a value of more than 100%.
1 2 3 4 5 6 7 8 9
Absolute deviation of BMI from
individual normal value
1
=
< - 7,5
2
=
- 7,5
3
=
- 5,0
4
=
- 2,5
5
=
0,0
6
=
+ 2,5
7
=
+ 5,0
8
=
+ 7,5
9
= > + 7,5
BMI (kg/m²)
Classification
< 18.5
Underweight
18.5 - 24.9
Normal weight
25.0 - 29.9
Overweight
≥ 30.0
Adiposity
30.0 - 34.9
Adiposity level I
35.0 - 39.9
Adiposity level II
≥ 40.0
Adiposity level III
Source:
World health organization, 2000
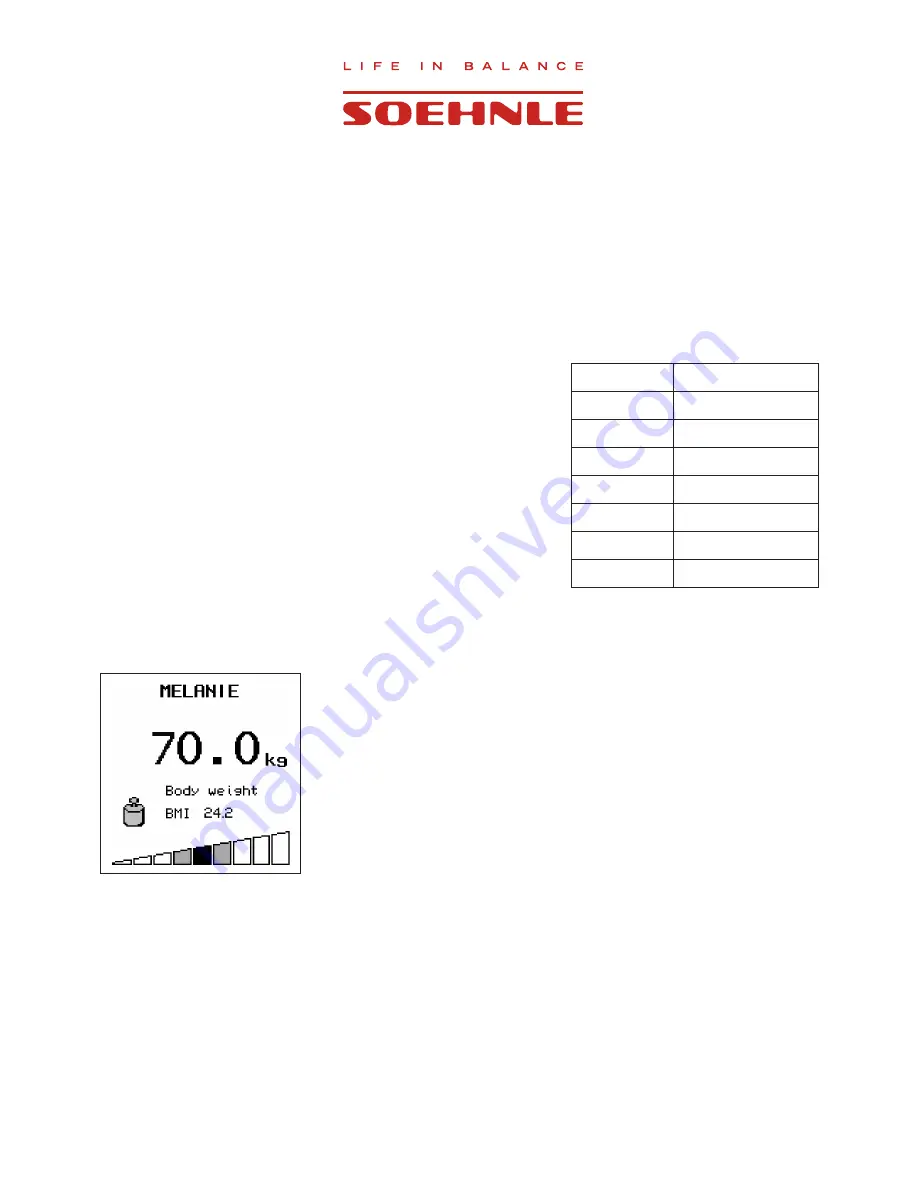
Body weight
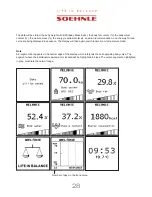
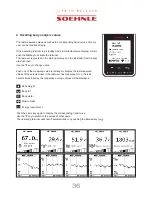
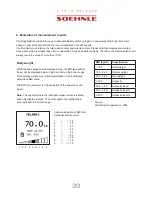
While the body weight will be displayed in kg, the BMI (Body Mass
Index) will be displayed below it; the bar chart on the bottom edge
of the display will show an initial interpretation of the individually
determined BMI value.
The BMI is a parameter for the evaluation of the body mass of a
person.
Note:
The segment where the individual measurement is located
will be highlighted in black. The center segments, highlighted in
gray, represent the normal range.

