43
Energy consumption
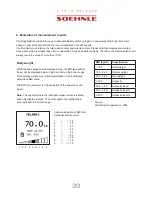
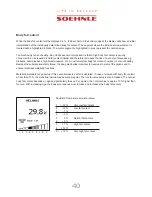
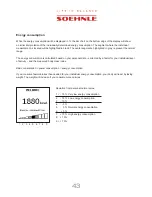
While the energy consumption will be displayed in %, the bar chart on the bottom edge of the display will show
an initial interpretation of the individually determined energy consumption. The segment where the individual
measurement is located will be highlighted in black. The center segments, highlighted in gray, represent the normal
range.
The energy consumption is calculated based on your personal data – corrected by a factor for your individual level
of activity – and the measured body mass index.
Basic consu power consumption = energy consumption
If you consume fewer calories than needed for your individual energy consumption, your body will react by losing
weight. The weight will increase if you consume more calories.
1 2 3 4 5 6 7 8 9
Deviation from personal normal value
1 < - 15 % Very low energy consumption
2 - 15 % Low energy consumption
3 - 10 %
4 - 5 %
5
0 % Normal energy consumption
6 + 5 %
7 + 10 % High energy consumption
8 + 15%
9 > + 15%


