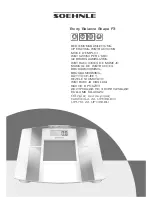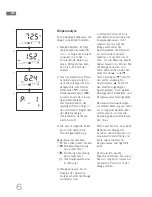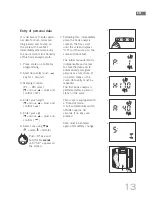
This body analysis scale
determines your individual
ideal condition in regards to
weight and body fat content,
based on your personal data
and recommendations by
health experts.
It also determined your total
body water content and mus-
cle mass.
Please remember that mus-
cles also contain body water,
which is already calculated in
the body water analysis.
Therefore, the total result will
always exceed 100%.
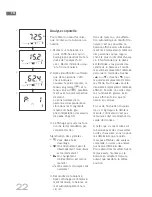
Individual Recommendation
15
1 2 3 4 5 6 7 8 9
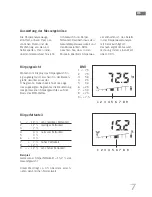
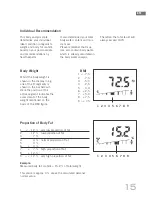
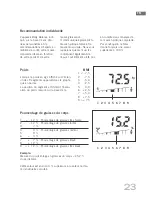
Body Weight
Whilst the body weight is
shown in the display in kg,
one of the 9 segments is
shown in the bar below it.
Here the position of the
active segment indicates the
assessment of the body
weight mentioned on the
basis of the BMI figure.
BMI
1 < - 7,5
2
- 7,5
3
- 5,0
4
- 2,5
5
0,0
6
+ 2,5
7
+ 5,0
8
+ 7,5
9 > + 7,5
1 2 3 4 5 6 7 8 9
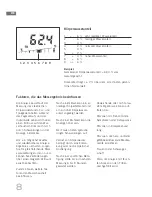
Proportion of Body Fat
1
< - 12 %
very low proportion of fat
2
- 12 %
low proportion of fat
3
-
7 %
4
-
3 %
normal proportion of fat
5
0 %
6
+
3 %
7
+
7 %
high proportion of fat
8
+ 12 %
9
> + 12 %
very high proportion of fat
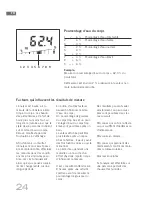
Example:
Measured body fat content = 15.2 % of total weight
This value is approx. 3 % above the calculated personal
normal value.
EN
Summary of Contents for Shape F3
Page 107: ...RUS 107 Soehnle E SOEHNLE Body Balance Body Balance 8...
Page 108: ...1 1 2 3 3 x 1 5 V Size AAA 2 3 4 1 2 3 1 0 0 p 2 3 4 108 RUS...
Page 109: ...4 5 6 7 3 2 1 2 1 3 P1 P8 4 5 6 3 0 0 7 0 0 40 109 RUS...
Page 110: ...2 2 2 3 1 5 10 2 151 3 4 3 110 RUS...
Page 112: ...6 8 E 112 RUS 1 2 3 4 5 6 7 8 9 1 6 2 6 3 4 4 2 5 0 6 2 7 4 8 6 9 6 62 4 2...
Page 113: ...RUS 113 x 150 x 100 0 1 0 1 100 250 10 99 8 3 x 1 5 AAA 1 2 3 4 1 2 150 3 4...
Page 123: ...GR 123 Soehnle SOEHNLE Body Balance Body Balance Body Balance 8...
Page 124: ...1 1 2 3 3 x 1 5 V Size AAA 2 3 4 1 2 3 1 0 0 2 3 4 kg cm st in lb in 124 GR...
Page 125: ...4 5 6 7 3 2 1 2 1 3 P1 P8 4 5 6 3 0 0 7 0 0 40 125 GR...
Page 126: ...2 2 2 3 1 5 10 2 3 173 3 4 3kg 126 GR...
Page 128: ...6 8 128 GR 1 2 3 4 5 6 7 8 9 1 6 2 6 3 4 4 2 5 0 6 2 7 4 8 6 9 6 62 4 2...
Page 147: ......

