Using Solar-Log WEB
Solar-Log
1000
User Manual
73 of 131
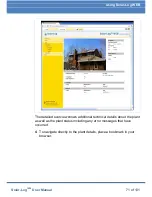
The detailed overview of your plant is shown.
2
Select
Graphics
in the left navigation bar.
The day overview of the plant is shown.
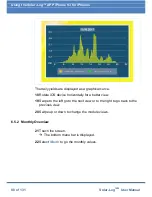
The daily yields are shown in a curve chart. The dark green line shows
the target value for the day.
Move the cursor over the curves to display the corresponding values.
Buttons for the day overview
Yield
: Yield line via which the yield trend can take place. In addition,
a dark green line is displayed as the total daily target.
Summary of Contents for Solar-Log 1000
Page 1: ......

