50
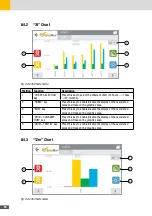
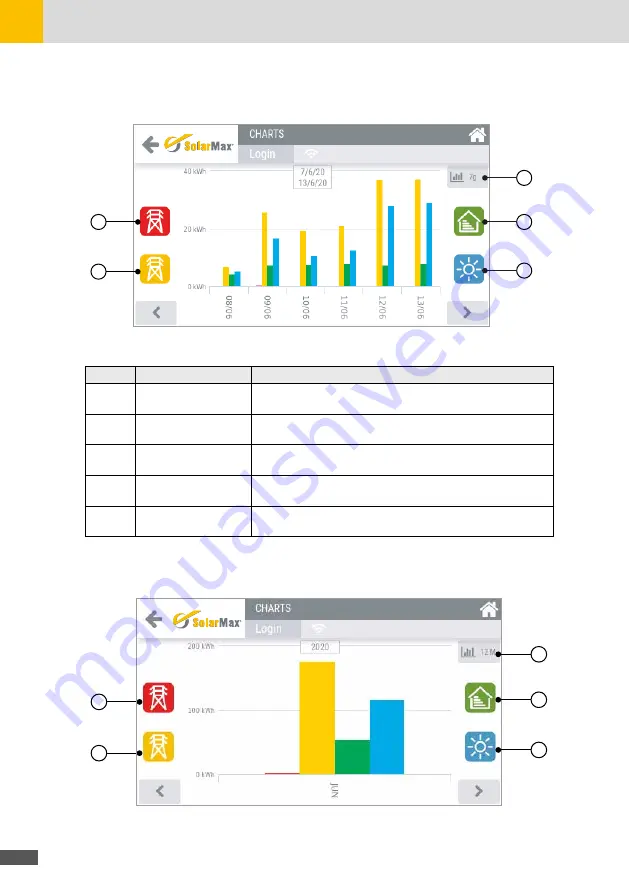
8�4�2 “7d” Chart
2
3
1
4
5
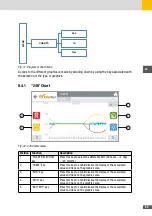
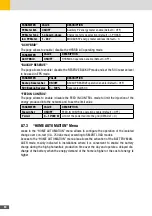
Fig. 33: 24h Charts menu
Position Function
Description
1
“CHART SELECTION”
key
Press this key to select the different chart (24 hours -->7 days
-->12 months)..
2
“HOME” key
Press this key to enable/disable the display of the associated
value and trace on the graphics area.
3
“SUN” key
Press this key to enable/disable the display of the associated
value and trace on the graphics area.
4
“GRID – CONSUMP-
TION” key
Press this key to enable/disable the display of the associated
value and trace on the graphics area.
5
“GRID – FEED IN” key
Press this key to enable/disable the display of the associated
value and trace on the graphics area.
8�4�3 “12m” Chart
2
3
1
4
5
Fig. 34: 24h Charts menu
Summary of Contents for 10ES-T
Page 1: ...Instruction Manual SolarMax ES T series 5ES T 6ES T 8ES T 10ES T ...
Page 10: ...10 3 2 Function Fig 2 Function of ES T ...
Page 22: ...22 5 2 Electrical connection diagram ES T Fig 6 Electrical connection diagram ...
Page 74: ...74 Fig 52 Login page The HOME page will appear Fig 53 HOME page ...


