background image


-86- 


6.7.11  CPAP Control 

 
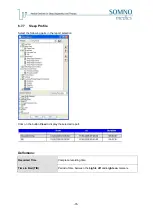
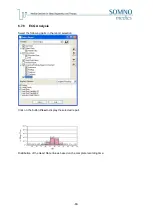
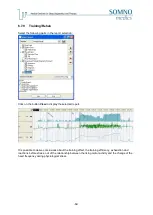
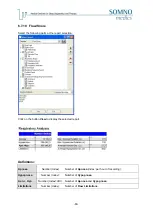
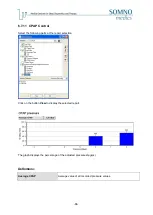
Select the following parts at the report selection: 


Click on the button 

View

 to display the selected report. 


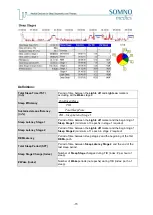
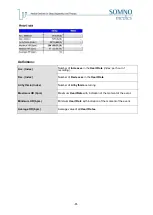
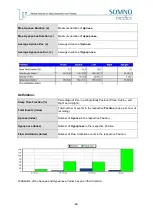
The graph displays the percentage of the adjusted pressure stage(s). 


Definitions: 

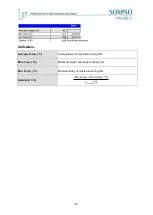
Average CPAP 

Average value of all recorded pressure values. 


Summary of Contents for SOMNOwatch plus

Page 1: ...cs GmbH Am Sonnenstuhl 63 D 97236 Randersacker Tel 49 0 931 35 90 94 0 Fax 49 0 931 35 90 94 49 E Mail info somnomedics de Internet www somnomedics de Caution Investigational device Limited by Federal...

Page 2: ...d with TM are protected copyright by SOMNOmedics Rev 4 14 11 2019 SOMNOmedics GmbH Am Sonnenstuhl 63 D 97236 Randersacker Tel 49 0 931 35 90 94 0 Fax 49 0 931 35 90 94 49 E Mail info somnomedics de In...

Page 3: ...6 2 2 1 Recording with external EMG Sensor 30 6 2 2 2 Recording with external Activity Sensor 31 6 2 3 Body Temperature 32 6 2 4 EDA 33 6 2 5 Sleep Profile 34 6 2 6 ECG Analysis Training Control Rehab...

Page 4: ...4 6 Light Analysis 102 7 3 4 7 Flow Analysis 103 7 3 4 8 Snore Analysis 104 7 3 4 9 Leg Movements LM Analysis 105 7 3 4 10 Heart Rate Analysis 107 7 3 4 11 FFT Analysis 108 7 3 4 12 HR Movement Analy...

Page 5: ...7 7 1 Creating a Form Letter 139 7 7 2 Opening a Form Letter 140 7 7 3 Save Form Letter in MS Word 2007 140 7 8 Data Exchange 141 7 8 1 Data Export as Picture in RIFF or ASCII Format 141 7 8 2 EDF Exp...

Page 6: ...6 10 5 Warranty 159 10 6 Disposal of Parts and or the SOMNOwatchTM plus 159 10 7 Accessories and Spare Parts 160 10 8 Contact 161 10 9 Notes 162...

Page 7: ...carefully placed and secured In case accessories are used which do not come from SOMNOmedics a bill will be issued for any repairs It is very important to protect the SOMNOwatch plus from temperatures...

Page 8: ...d Breathing Disorders during sleep The SOMNOwatch plus is a non life supporting portable physiological signal recording device The SOMNOwatch plus is not intended to be used alone or in combination wi...

Page 9: ...atch plus fig 2 2 Typenschild Information Symbols Icons and Classifications on the Type Label Read the instruction manual very carefully before you start working with the SOMNOwatch plus Protection Cl...

Page 10: ...n and yellow LED is alternately flashing 16x s flashes 16x s off flashes 16x s off off flashes 16x s off flashes 16x s Patient Marker Pressing this button during the connection to a PC switches on the...

Page 11: ...the basic set Actigraphy SOMNOwatch plus Watch Strap size M Docking Station Battery Charger USB Cable Bag for device and sensors Manual Software DOMINO light 2 Licenses You will find a list with addit...

Page 12: ...e 50 C Furthermore the SOMNOwatch plus should not be worn during swimming and showering Operate the device in an environment with the humidity between 10 and 90 Non Condensing This device complies wit...

Page 13: ...13 Damaging the warranty seal will result in an instant loss of warranty Always use the SOMNOmedics Docking Station SOW106 to charge the internal battery Otherwise the battery can be damaged...

Page 14: ...that the Software must be activated by entering a Registration Code see chapter 7 3 2 You will find the file on the installation CD Double click on this file to start the installation Choose your lang...

Page 15: ...15 Accept the selection New Installation by clicking the Next button Choose SomnoWatch Plus at Montage and click on the Next button Start the installation process by clicking the Next button...

Page 16: ...will ask if you want to install the USB driver for the Docking Station If you choose to Install SOMNOmedics USB Driver now the manual selection of the driver file location will not be required in Cha...

Page 17: ...the Software To update your software version please install the new version in the same directory as the basic version During the installation you will be asked to choose one of the following install...

Page 18: ...18 After the installation of the update you have to confirm your registration ID in the global preferences Confirm the Code in the Tab folder by clicking on Save and Exit...

Page 19: ...nnect the SOMNOwatch plus Docking Station to a USB port the following window will occur Please choose the option No not this time and click on the Next button Make sure you have the CD ROM with the Dr...

Page 20: ...of Summer Winter time will have a time shift 6 1 Initializing the SOMNOwatch plus fig 6 1 DOMINO light Panel After a successful connection the serial number the firmware version the hardware ID and th...

Page 21: ...ata into the corresponding fields Type carefully as this information will be saved for later use It is important to enter a Patient ID number This number is used to store the Patient Data in the optio...

Page 22: ...icular application The montage defines the channels that will be recorded Depending on the application we recommend the following montages Activity Analysis fig 6 4 Montage Activity Analysis Sleep Wak...

Page 23: ...23 Tremor Analysis fig 6 6 Montage Tremor PLM RLS Analysis a with external EMG Sensor b with external Activity Sensor fig 6 7 Montage PLM RLS...

Page 24: ...24 Body Temperature fig 6 8 Montage Temperature EDA fig 6 9 Montage EDA...

Page 25: ...25 Sleep Profile fig 6 10 Montage Sleep Profile ECG Analysis fig 6 11 Montage ECG...

Page 26: ...26 Training Rehab fig 6 12 Montage Training Rehab Flow Snore fig 6 13 Montage Flow Snore...

Page 27: ...re it is necessary to choose an applicable analysis template for the recording It is possible to create and change these analysis templates in the Global Settings see chapter 7 3 4 Magnitude Quantitat...

Page 28: ...Now you can enter an observation or comment in the Description window 6 This information appears in the Open Recording window When you click on Initialise the internal memory will be deleted and the m...

Page 29: ...ake Analysis Tremor Analysis a Attach the Watch Strap to the SOMNOwatchTM plus b Apply the SOMNOwatchTM plus to the wrist of the non dominant hand If the SOMNOwatchTM plus is used for Tremor Analysis...

Page 30: ...above the ankle of the right foot external connector to the top d Clean the skin area on the left leg Tibialis anterior Connect three disposable Snap Electrodes to the EMG Sensor Remove the protectiv...

Page 31: ...the SOMNOwatchTM plus above the ankle of the right foot external connector to the top c Attach the external Activity Sensor to the second Foot Strap and apply it to the ankle of the left foot Lead th...

Page 32: ...e Body Belt and apply it to the patients thorax b Connect the Temperature Probe to the blue adapter box and than the box to the SOMNOwatchTM plus Slip a protection cover over the end of the Temperatur...

Page 33: ...st of the non dominant hand c Attach the EDA Sensor to the Watch Strap and connect the cable to the SOMNOwatchTM plus Clean the skin areas at the palm of the hand Connect two electrodes to the EDA Sen...

Page 34: ...x b Clean the skin areas at forehead and behind the left ear Attach disposable Snap Electrodes to the connectors of the sensor remove the protective foil and apply them to the head Lead the connecting...

Page 35: ...skin areas at the upper part of the body Attach disposable Snap Electrodes to the connectors of the sensor remove the protective foil and apply them Please note that the electrodes are not placed on...

Page 36: ...ax b Apply the Nasal Cannula and lead the tubes along the back side of the ears Fix the Nasal Cannula by moving the sleeve under the chin Fix the Pressure Sensor to the Body Belt and connect the cable...

Page 37: ...e cable of the Pressure Sensor to the SOMNOwatchTM plus and screw the Silicone Tube onto the Luer Lock Connector of the Pressure Sensor Attach the open end of the Silicone Tube to the O2 connector of...

Page 38: ...iling program with the recording attached 2 It is possible to instruct the software to automatically produce an analysis to display a report to print and export a report and to close the recording To...

Page 39: ...e entered It is also possible to Reset and Re analyse 4 a recording This function will remove all manual editing and completely re analyse the study using the predefined parameters in the Global Prefe...

Page 40: ...lysed the Preferences Window will open Choose a matching Analysis Template or create one in the Analysis menu of the Global Settings Activity Analysis fig 6 18 Analysis Template Activity Analysis Slee...

Page 41: ...41 Tremor Analysis fig 6 20 Analysis Template Tremor Please ensure that only one of the axes x y or z is selected Please do not select Magnitude PLM RLS Analysis fig 6 21 Analysis Template PLM RLS...

Page 42: ...42 Body Temperature fig 6 22 Analysis Template Temperature EDA fig 6 23 Analysis Template EDA...

Page 43: ...43 Sleep Profile fig 6 24 Analysis Template Sleep Profile...

Page 44: ...44 ECG Analysis fig 6 25 Analysis Template ECG Analysis Training Rehab fig 6 26 Analysis Template Training Rehab...

Page 45: ...45 Flow Snore fig 6 27 Analysis Template Flow Snore CPAP Control fig 6 28 Analysis Template CPAP...

Page 46: ...ouble click on a particular position in the Analysis Data window will synchronize to the corresponding Raw Data in the window below Time base of Analysis Window Change with right mouse button Paramete...

Page 47: ...tivity Analysis Definition of User Areas Mark a section in the Analysis Window by holding the left mouse button pressed Right click in the marked section and choose Define area as Type in a relevant d...

Page 48: ...Repeat these steps for all the areas you want to analyse Go to User areas in the Tools menu to delete wrong defined areas Attention The definitions TIB and Day are fixed definitions The definitions mu...

Page 49: ...of the Light Sensor The areas will be marked in blue colour 6 5 2 3 Rasterviw If you want to depict the Raster View in your report you can choose between three different displays You can also add othe...

Page 50: ...channels can be choosen and removed via Drag Drop or via using the finger icon 1 For the time basis of the Raster View there are time intervals from 5 seconds up to 2 days available In addition a dou...

Page 51: ...ort you can choose between three different displays In case your manually modified Raster View shall be displayed within the report this has to be saved as a sample By using the print button a selecti...

Page 52: ...delete the marker If you do not set a Lights OFF or Lights ON marker the complete recording will be defined as TIB Recording with more than one night or Analysis of specific periods Mark a night or a...

Page 53: ...activity or marker select Lights off Set Lights ON Right click on the raw data area at the time the patient gets out of bed check body position activity or marker select Lights on Note There should b...

Page 54: ...Lights OFF and Lights ON marker in the recording Go to Tools Edit markers and click on the symbol right beside the requested marker to delete the marker If you do not set a Lights OFF or Lights ON ma...

Page 55: ...55 In order to obtain the Poincar Plot of the heart rate variability one should open the corresponding window via going through Tools Poincar Plot...

Page 56: ...is opened for the first time the Sleep Profile will be analysed and displayed automatically according to the pre programmed parameters set in the Global Preferences see chapter 7 3 4 The Sleep Stages...

Page 57: ...the predefined keys to edit the respective epoch The software will automatically jump to the following epoch The manually edited epoch will be displayed in red letters fig 6 31 and marked by a green b...

Page 58: ...32 Definition of Sleep on set Subsequently you will get asked if you want to accept this A B FFT threshold for the detection of Wake fig 6 33 Dialogue window of sleep onset If Accept is chosen the sof...

Page 59: ...arrow see fig 6 34 Scroll in the Raw Data Window to the transition from light sleep to deep sleep Right click at this position and select Deep sleep threshold fig 6 35 Definition of Deep sleep thresh...

Page 60: ...ing on the green rightwards pointing arrow see fig 6 36 Scroll in the Raw Data Window to the point of awaken Right click at this position and select End sleep Please note The Sleep Profile will displa...

Page 61: ...responding text fields The Choose Finding and Choose Diagnosis buttons offer lists of selectable predefined findings and diagnosis fig 6 38 Input mask 6 7 Open the Report Open the Report Selection by...

Page 62: ...ofile is compared with the mentioned groups mean Activity in the selected area mean Activity in all areas defined as school in due consideration of the duration of the separate areas mean Activity in...

Page 63: ...63 Choose the item Activity profil within the Select Report window...

Page 64: ...elected report The report shows information regarding to the marked Sleep and Wake Areas Sleep Time Time in stage NONREM during TIB Wake Duration Time in stage Wake during TIB Total Sleep Period SPT P...

Page 65: ...t NONREM stage WASO Wake after sleep onset Time of Wake epochs during the TIB after sleep onset MAI Index Number of vegetative arousals b Automatic detection of TIB and Day areas Select the following...

Page 66: ...tionally it is possible to get displayed information on sleep in a fixed 24 hour raster In this case the analysis steps shown in chapter 6 5 2 2 are not necessary Select the following parts in the rep...

Page 67: ...tion A day by day Sleep Wake Profile can also be displayed Select Raster view in the Tools menu Select Analysis the Sleep Wake channel and a 1 day Time base It is possible to document disturbances of...

Page 68: ...68 6 7 3 Tremor Analysis Select the following parts in the report selection Click on the button View to display the selected report...

Page 69: ...report selection Click on the button View to display the selected report Please Note Only events during TIB will be evaluated in the report Definitions Recorded Time Complete recording time Time in Be...

Page 70: ...dy Position during TIB PLM distribution bar graph The index for the PLM distribution is shown in lying and upright body position The distribution will indicate whether the RLS Restless Legs Syndrome d...

Page 71: ...71 Analysis of more than one night or Analysis of specific periods Select the following parts in the report selection Click on the button View to display the selected report recording on both legs...

Page 72: ...72 recording on both legs...

Page 73: ...ect the following parts in the report selection Click on the button View to display the selected report Definitions Recorded Time Complete recording time Time in Bed TIB Period of time between the Lig...

Page 74: ...Definitions Average Temp C Average Body Temperature during TIB Max Temp C Maximum Body Temperature during TIB Min Temp C Minimum Body Temperature during TIB Gradient C h h t C Temp Min Temp Max Temp...

Page 75: ...lected report The determined values will be displayed as conductance values unit Siemens S in a graph The electrodermal activity is affected by the sympathetic nervous system e g emotional reactions T...

Page 76: ...ct the following parts in the report selection Click on the button View to display the selected report Definitions Recorded Time Complete recording time Time in Bed TIB Period of time between the Ligh...

Page 77: ...minimum of 3 epochs in stage 1 required Sleep Latency Stage 2 Period of time between the Lights off marker and the beginning of Sleep Stage 2 minimum of 1 epoch in stage 2 required REM Latency Period...

Page 78: ...shows how Disturbed or Undisturbed a patient s sleep is Disturbed Sleep fragmentation mainly in the intervals 0 1 min and 1 5 min Undisturbed Sleep fragmentation mainly in the intervals 10 30 min and...

Page 79: ...p Duration during REM Time which the patient spent in the respective Body Position during REM sleep Duration during Non REM Time which the patient spent in the respective Body Position during Non REM...

Page 80: ...0 6 7 8 ECG Analysis Select the following parts in the report selection Click on the button View to display the selected report Distribution of the Heart Rate Values based on the complete recording ti...

Page 81: ...Index Number of Decreases in the Heart Rate Arrhythmia Index Number of Arrhythmia occurring Maximum HR bpm Maximum Heart Rate with indication of the moment of the event Minimum HR bpm Minimum Heart R...

Page 82: ...tton View to display the selected report It is possible to derive conclusions about the training effect the training efficiency exhaustion and reactions before stress out of the relationship between t...

Page 83: ...on the button View to display the selected report Definitions Apnoea Number Index Number of Apnoea index per hour of recording Hypopnoea Number Index Number of Hypopnoea Apn Hyp Number Index AHI Numb...

Page 84: ...ntage of time in a Single Body Position Prone Supine Left Right and Upright Total Events Index Total number of events in the respective Position index per hour of recording Apnoea Index Number of Apno...

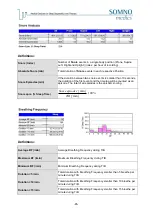
Page 85: ...e The total of all episodes is the episodic snoring Snore epis Sleep Time TIB episodes Snore 100 min min Definitions Average BF min Average Breathing Frequency during TIB Maximum BF min Maximum Breath...

Page 86: ...following parts at the report selection Click on the button View to display the selected report The graph displays the percentage of the adjusted pressure stage s Definitions Average CPAP Average val...

Page 87: ...sh to make regarding the improvement of this Instruction Manual will be much appreciated Technical Specifications are subject to change without notice 7 1 System Requirements System requirements for r...

Page 88: ...nels to record and determination of start time and duration Transfer Select this icon to transfer a Recording from the SOMNOwatch plus to the PC Analysis Used for analysing an existing measurement Glo...

Page 89: ...save changes made e g entry of the registration code 7 3 1 Selection of device type It is necessary to select the device type when changing settings There are two types to select from a SOMNOwatchTM b...

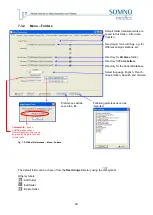
Page 90: ...using the symbol Other symbols Add folder Edit folder Delete folder Preferences will be saved to a file Following preferences can be imported Select language English French Greek Italian Spanish and...

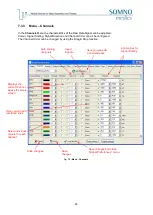
Page 91: ...hannel Order can be changed by using the Drag Drop function fig 7 3 Menu Channels Here you can add a new reference Auto scaling of signals Invert signals Limit values for Signal Scaling Displays the c...

Page 92: ...as device type Settings can be saved in an analysis template This is done by clicking on New Template To delete it click on Delete Template In the local analysis settings settings in an open recordin...

Page 93: ...Activity Threshold the epoch will be scored as Wake The parameter Number epoch before after causes that short periods with activity during sleep e g body position change will not be scored as Wake Ex...

Page 94: ...ges for correlating signals When correlation occurs the sleep stage is given a specific score the quantifier which is user defined Subsequently the software assumes the Sleep Stage which received the...

Page 95: ...fact must have to be recognized by the sleep FFT analysis to classify the epoch as movement In define inaccurate stage you can specify with a percentile probability when an epoch is to be declared as...

Page 96: ...och in relation to the maximum value in the recording AFV The Average Frequency Value is the mean frequency of the EEG Hz in the epoch Spindle number of spindles per epoch Sigma Power of the Sigma Fre...

Page 97: ...ange of the signal in in relation to the baseline This value must be exceeded for a spindle to be detected 5 Min Ampl V Minimum amplitude of the Spindle EEG signal to determine Spindle 6 Min Duration...

Page 98: ...y duration of a peak to peak drop in order to determine a K complex 13 Max Amplitude V If the amplitude of the EEG signal is higher than the entered value no K complex is recognized fig 7 10 EEG Curve...

Page 99: ...tefact is detected if below a frequency of 0 5 Hz the FFT amplitude exceeds the value entered here 3 Delta A B Smoothing Here the intensity of the smoothing for the delta or alpha beta curve are set T...

Page 100: ...e MA 3 Treshold Hz In this field the upper limit for the start of an increase is defined i e all increases starting above this threshold will not be considered when determining MAs fig 7 13 AFV Curve...

Page 101: ...tivity is equal to the maximal value within the timeframe Average value Activity is equal to the value composed of the average value within the timeframe Illustration Line Bar Activity Threshold mg Th...

Page 102: ...coherent TIB area is shorter than the preset duration the area will be changed to Day Min Wake duration min If a coherent Day area is shorter than the preset duration the area will be changed to TIB...

Page 103: ...values below this ratio are detected as Apnoea 6 Hypopnoea Ratio The Hypopnoea ratio states the fractional flow relative to the baseline All values below this ratio and above the Apnoea ratio will be...

Page 104: ...Activating this function will count an Apnoea Hypopnoea event as sleep during the first wake stage after a respiratory event The event however must start in a sleep stage 7 3 4 8 Snore Analysis fig 7...

Page 105: ...in relation to the baseline All values above this ratio will be detected as a Leg Movement The internal activity channel of the SOMNOwatchTM plus Magnitude is analysed here 3 Ratio PLM This ratio sho...

Page 106: ...M l PLM r for a simultaneous movement to be detected 10 Min Distance s Minimum distance between 2 Leg Movements for a PLM event to be detected 11 Max Distance s Maximum distance between 2 Leg Movement...

Page 107: ...ected 5 Artefact Variation bpm Maximum change in consecutive Heart Beats An artefact will be detected if the difference is larger than this value Sympatho Vagal Balance The heart rate variability HRV...

Page 108: ...e g Parkinson Tremor the monitoring of therapy or the adaption of drug giving fig 7 22 FFT Analysis 1 Smoothing factor With this value it is possible to smooth the FFT curve 2 Min Freq Hz Lower limit...

Page 109: ...ement Analysis The Analysis displays the Heart Frequency changes during motor Activity bpm mG Smoothing The detected curve is smoothed using this value 7 3 4 13 Position Analysis fig 7 24 Position Ana...

Page 110: ...Gradient C h The Temperature Report will display insufficient decrease if the determined gradient falls below this value fig 7 26 Determination of gradient 7 3 4 15 CPAP Analysis The pressure sensor r...

Page 111: ...othes the raw data signal by averaging the value every 250ms a new average value is formed The determined values are used as conductances unity Siemens S in a represented curve The electro dermal acti...

Page 112: ...tion coloured frames will mark the events of the respective signals in the Raw Data window Auto Size This option will scale the amplitude of the curve automatically Marker It is possible to set refere...

Page 113: ...tly modified version of an existing Profile as a new Profile For the Dual Time Base two raw data templates are represented at the same time with a horizontal splitting line two raw data profiles can b...

Page 114: ...be called upon in the opened recording with a right click in the analysis window fig 7 32 Menu Analysis Profiles The button Save as will save the profile with a new name This allows you to quickly and...

Page 115: ...red in order to use the Quick Edit Mode see chapter 7 5 1 2 This mode allows editing with the mouse In this Menu you may set the channel on which an event should be marked Please note Make sure you a...

Page 116: ...xisting area from the box and click the button Delete Area It is possible to recover the default area definitions by clicking the Restore standard areas button 1 Enter the information you require to b...

Page 117: ...sh to appear on a new page and then click on To remove the Page Break click on In the Reports Menu it is possible to configure Standard Report Templates to your specific needs You can set the contents...

Page 118: ...39 Symbols in User Defined Report Note After you click on a symbol you first have to choose the right position of the desired object by left clicking on the draft Opens the Standard Report Here you ca...

Page 119: ...t Pictures e g a company logo can be added in JPG or BMP format Diagrams used in the Standard Report can be pasted Placeholders can be generated for the import of Samples Type in a specific name for t...

Page 120: ...ng TIB fig 7 42 Analysis Channels selection Zoom In Zoom Out Additional functions full short only legend without Activates Deactivates the timeline The graphic can be rotated in pre defined steps Sele...

Page 121: ...able 1 Edit opens the window to edit the properties of an object 2 Send to back places the selected object in the background This is used to display object in the right order 3 Send to front places th...

Page 122: ...he button New Custom Template After defining a name for the new Custom Template generate or edit the new custom report using the Edit button that is available in the lower menu bar After defining the...

Page 123: ...friendly method of editing text fields in the custom report is provided Here items like the font size Text Alignment Bold Italic Underline etc can be defined Using Items from the Standard Report in t...

Page 124: ...the individual components required and they will be marked with little grey squares in their corners Multiple items can be selected by holding down the Shift button on the keyboard while clicking on...

Page 125: ...f the quick start toolbar can be added With this command button the order of the indicated functions can be changed You can reach many of the quick start command buttons and their functions in the mai...

Page 126: ...that recording Changes made to the Parameter Settings in the Global Preferences are the default settings for all studies To cancel all manual editing made to a recording select Reset and re analyse w...

Page 127: ...ers a comfortable method to manually select analysis channels to be displayed fig 7 50 Selecting Channels for Analysis Display Enter a name for the analysis profile and click OK If the profile should...

Page 128: ...n to get the following functions 10 Zoom selection will display the marked area across the whole analysis window 11 Show in bottom chart will display all correlating Raw Data for the section selected...

Page 129: ...a comfortable method to manually select raw data channels to be displayed fig 7 52 Selecting Channels for Raw Data Display Delete all channels Invert selection All Raw Data channels will have the same...

Page 130: ...leep and Sleep on set are only selectable in recordings with activated Sleep Profile Analysis The functions are described more detailed in chapter 6 5 2 8 at Advanced Sleep Edit Mode 10 FFT Module wil...

Page 131: ...arker Select the Marker from the list as follows Double click to select the desired marker within the Markers menu or click on the desired marker in the menu and click on the green arrow to accept it...

Page 132: ...th the right mouse button Select Save Sample and enter a descriptive name for this sample and click on OK The sample will be saved and added to the report and the optional Database fig 7 55 Save Sampl...

Page 133: ...n the global preferences see chapter 7 3 11 and confirm with OK Delete and Edit a User area Choose user areas from the tools menu It opens a list of all defined areas delete User areas change colour o...

Page 134: ...ill be displayed Repeat this procedure for all required sections of the recording fig 7 58 Display of Curve Averaging All selected signals in the defined selections and the resulting averaged curve ar...

Page 135: ...ode If it is necessary to change the time base deactivate Lock Time in the Mode menu To delete an event place the mouse cursor inside the frame and right click on it You can display the manually delet...

Page 136: ...Mode also allows an event to be marked without using the keyboard Drag the cursor over the event to be marked and release the mouse button Now you get a list with all the events you can define on the...

Page 137: ...you can select if the area is a global artefact all analysis or an artefact at a single analysis channel Please note If an event is manually scored within a local artefact area the following dialogue...

Page 138: ...tion The settings for the Report Templates are made in the Global Preferences Standard Report Template see chapter 7 3 13 1 User Defined Template see chapter 7 3 13 2 7 6 2 Export Result List to MS Ex...

Page 139: ...iting Form Letter Additionally it is also possible to use the Insert Word Field to request information from the operator Enter the name you wish to save the Form Letter under and click on the Save but...

Page 140: ...eports menu Double click on the required Form Letter and it will be opened in MS Word automatically 7 7 3 Save Form Letter in MS Word 2007 Click on Start Mail Merge in the Mailings menu and choose Nor...

Page 141: ...s devices This feature is useful for international studies and clinical trials The SOMNOscreen provides 2 methods of exporting to EDF EDF export of unfiltered Raw Data Select a recording in the Open...

Page 142: ...window fig 7 67 EDF Export Settings for Channel EEG The settings of the chosen channel Name Dimension Physical and Digital Minimum Maximum as well as Pre filtering are displayed The Name of the Chann...

Page 143: ...ick in one of the fields next to the Channel name Click on the button OK to confirm and return to figure fig 7 67 You can save your channel selection and the changes made to the translation table as a...

Page 144: ...e Layer DVD s are supported and it is possible to burn multisession CD s Click on the button Analysis on the DOMINO light panel and select Open in the dialog window In the following window click on Ar...

Page 145: ...ving Data Writing Successful will be displayed on the screen after the recording has successfully been completed The CD symbol and the CDs Name will be displayed under the Archived Heading against eac...

Page 146: ...er and select the directory which contains your folders Archives Form Letters and SOMNODB Default Location C SOMNOmedics Somnowatch Now select the files and copy them to a local directory for example...

Page 147: ...for patients according to different criteria and to sort and display them in any order The File menu includes the Import feature which makes it possible to import CSV files 7 10 1 Registration In orde...

Page 148: ...4 a equals b greater c greater or equal to d smaller e smaller or equal to f unequal Connect a type of event 1 to a value 5 using a relational operator 4 then click search The search result will be s...

Page 149: ...cordings for a specific patient from this menu At any time you can access the search tool via the Search menu and start a new search Patient data and corresponding measurements Click here to edit the...

Page 150: ...efine a Default Template Click on the New Template button and type in a template description Confirm your entry by clicking the OK button Choose the desired results from the list and click the Save bu...

Page 151: ...ed by selecting Report in the main menu It is possible to select pre defined report templates see chapter 7 3 13 1 or only single reports The order can be changed by Drag Drop and it is possible to ad...

Page 152: ...152 7 10 5 Menu Summary Picture fig 7 76 Menu Summary Picture This Menu shows the Summary Graphics from the Patients Analyses Curves...

Page 153: ...ding and select Results from the Tools menu fig 7 77 Results list Choose an existing template 1 or add single Analysis results 2 by selecting Select Results from the Tools menu Mark the Analysis resul...

Page 154: ...ata base including the hypnogram it is possible to display a sleep stage comparison Switch to the tab History or Recording and select Results from the Tools menu Select Compare Sleep Stages from the m...

Page 155: ...d then delete them from the hard disk Check to ensure that you have the correct rights to save data from your System Administrator Measurement does not start Pre programmed measurement does not start...

Page 156: ...ves if necessary Follow manufacturer s instructions External Pressure Sensor Flow Snore Wipe disinfection For example Terralin Liquid Mikrozid AF Cloth Ready to use Ready to use 5min 5 min After use R...

Page 157: ...oth Ready to use Ready to use 5min 5 min After use Remove adhesives if necessary Follow manufacturer s instructions Use protective gloves when using aggressive disinfectants Follow the manufactures in...

Page 158: ...5 CPAP Pressure 0 18mbar DC 0 09Hz 0 2mbar ECG 4mV 0 1Hz 100Hz 5 EEG 600 V 0 2Hz 35Hz 5 Temperature 34 3 39 C 1 C EDA 0 2M 10 Data Processing 12 Bit ADC Different Sampling Rates Adjustable 1 60s 256 s...

Page 159: ...cts have to be wrapped up in antistatic bubble envelopes and cased in device specific protective bags For the shipping the bag has to be put in an adequate box 10 5 Warranty SOMNOmedics will only guar...

Page 160: ...m Kabel 2m external ECG Sensor for PLM ECG recording 30 disposable Electrodes Body Belt Mount Body Belt size L SOW131 EEG Sensor Kit external EEG Sensor 30 dis90 posable Electrodes Body Belt Mount Bod...

Page 161: ...we can call you back promptly With our Service Login you have free of charge access to our latest software updates www somnomedics de We also provide service and support via e mail service somnomedics...

Page 162: ...162 10 9 Notes...

Reviews: