KT-160 USER MANUAL
108
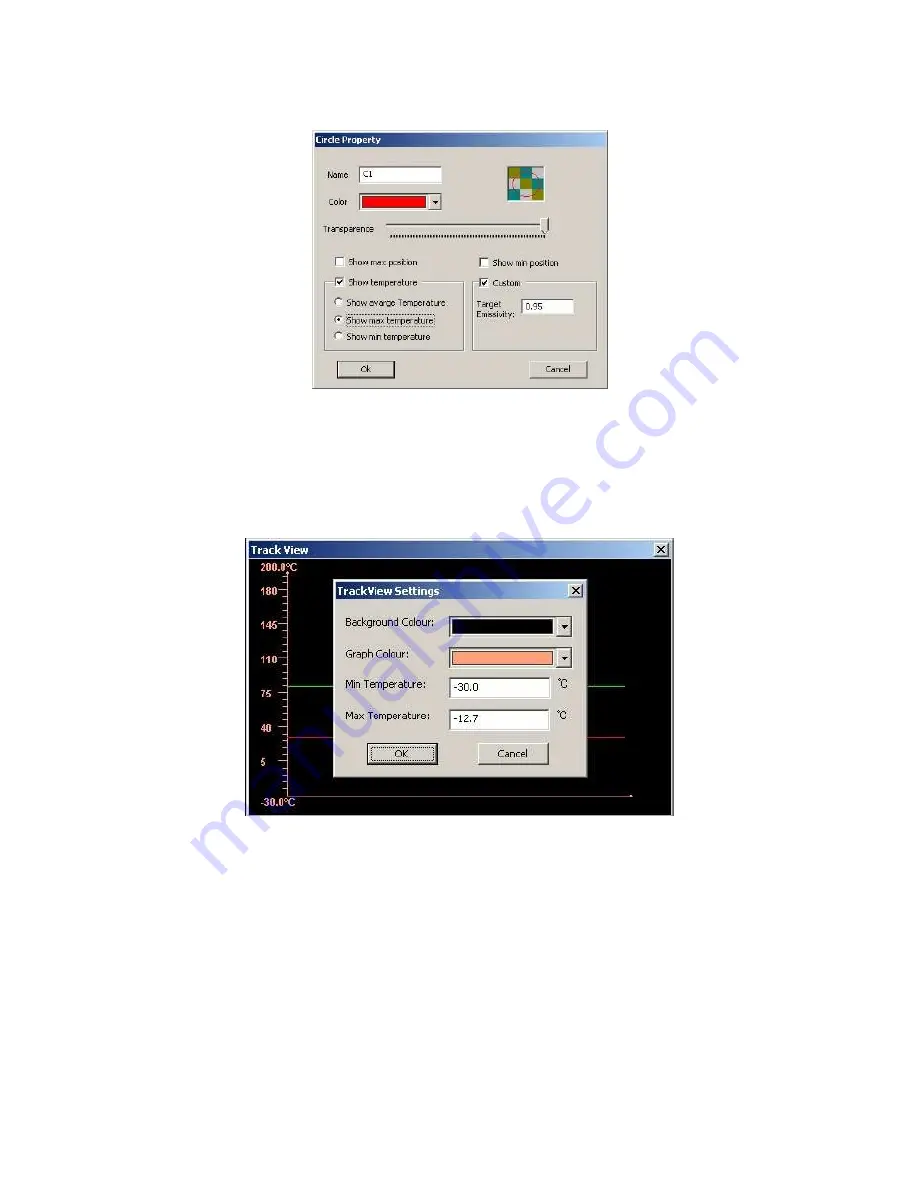
After clicking chosen object, a window opens allowing the user to change the colour line,
and the transparency of selected object:
Double-clicking with the left mouse button on window "View path" opens a dialogue box
where the user can change its settings: background colour, the axis lines on the graph,
the maximum and minimum temperature on the axis. To accept the changes, click OK,
and to return to the previous settings select "Cancel".
NOTE: The chart line is in the same colour as the selected object's colour.
Because the colour of the graph line depends on the colour of an object, we can analyse
using a single window the temperature changes in many points and areas.
Pressing function key F11 on the PC keyboard allows the user to save the current view of
"Path view" window as a JPG file in the directory where the captured video images are
stored (see section 5.3).
Menu "Measure" - command "Histogram"
Selecting command "Image histogram" or "Other histogram" enables user to display the


