PQM-700 Operating Manual
60
During the interruption, the analyzer remembers the minimum recorded voltage and the average
voltage value.
Swell is a state of increased
voltage. The swell threshold is
usually set at the level close to
110% of U
nom
.
The swell starts at the mo-
ment when the U
RMS(1/2)
voltage
increases above the swell thresh-
old value, and ends at the mo-
ment when the U
RMS(1/2)
voltage is
equal or less than the swell
threshold value minus the voltage
hysteresis. During the interrup-
tion, the analyzer remem-bers
the maximum recorded voltage
and the average voltage value.
The hysteresis for all three
states is the same, and it is a
user-defined percent of nominal
voltage U
nom
(
Events detection hysteresis
parameter).
The analyzer remembers the event start and end time (with a half a period accuracy).
The minimum voltage dip, interruption and swell duration is half a period.
The U
RMS(1/2)
values are determined during 1 period when the fundamental voltage component
passes the zero and they are refreshed every half-period, independently for each voltage channel.
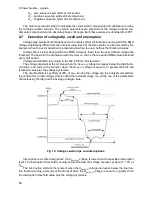
This means that these values will be obtained at different times for different channels. Fig. 20 shows
the method of the RMS
1/2
determination with two voltage phases. Information about the fundamental
component’s passing the zero is obtained by FFT.
6.8
CBEMA and ANSI curves
CBEMA curve was first proposed in the 70's of the last century by the organization that gave
the curve its name -
Computer and Business Equipment Manufacturers Association
(now
Infor-
mation Technology Industry
), which associated manufacturers of computer and office equipment.
The curve was developed as a guide in the construction of power supply adapters and at the be-
ginning it was a graph showing the tolerance of equipment to the size and duration of the disturb-
ances in the power grid. Later, the curve was used to design equipment sensitive to voltage fluctu-
ations as the reference range in which the equipment must operate properly. Finally the curve began
to be widely used in the analyses of power-supply quality in terms of disturbances such as swell,
dip, interruptions.
The vertical axis of the graph presents voltage in percent of the nominal value, whereas the
horizontal axis presents time (in logarithmic scale). The middle part of the graph (between curves)
represents the area of the correct operation of the device. The area above represents high voltage
conditions that may damage the device or trigger over-voltage protection, while the area under the
curves represents a situation of low voltage in mains, which may disconnect the power supply or
temporary power shortage resulting in incorrect operation of the equipment.
Fig. 20. Determination of the U
rms(1/2)
value.
Summary of Contents for PQM-700
Page 85: ...85 Notes...


