6 Power Quality - a guide
63
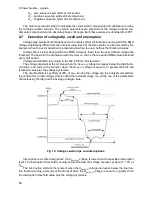
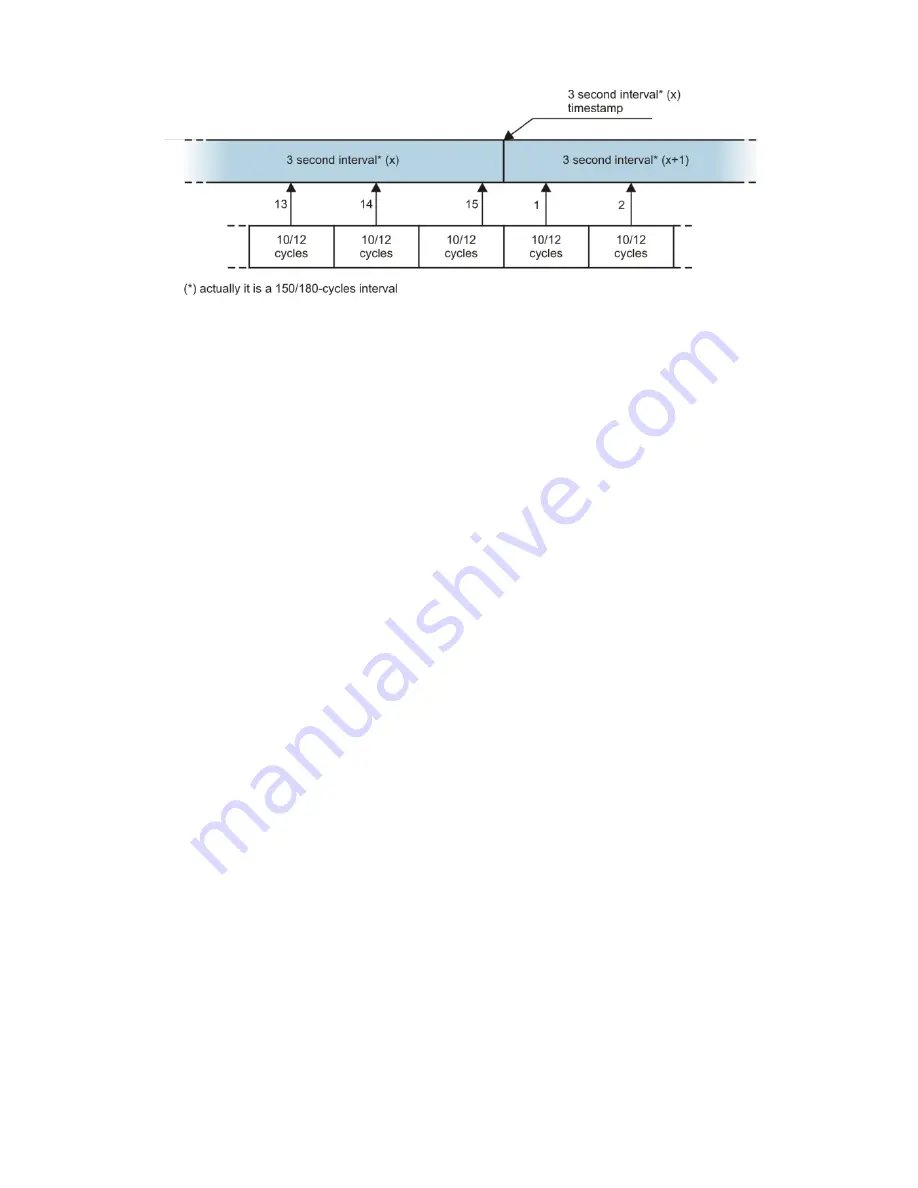
Fig. 23. Determining the averaging intervals shorter than 10 seconds (with the 3-second
averaging).
The method of average values determination for such periods is shown in Fig. 23. Here, we do
not have synchronization with the real time clock. When a defined number of 10/12-period meas-
urement is collected, the instantaneous averaging period is closed and a new one starts. The time
stamp corresponds to the end of the interval.
Averaging of measurement results leads to the loss of extreme values (smoothing of results).
In cases when the information about a limit value of the measured parameter is essential, the user
can take advantage of the option of measuring the minimum, maximum and instantaneous values
in the averaging period. If a given parameter is measured in the 10/12-period time, the minimum
and maximum value is respectively the smallest and the largest 10/12-period value measured in a
given averaging interval. On the other hand, the instantaneous value is the last 10/12-period value
in this averaging interval.
In case of RMS current and voltage, the method of searching for minimum and maximum values
is more flexible and it is controlled by the
Min/Max calculation period
parameter. The user can
take advantage of the following options: half period, 200 ms, 1 s, 3 s and 5 s. If the half period option
is selected, the minimum and maximum values will be searched for with the highest sensitivity
– to
the U
rms(1/2)
. As this time is increasing, additional smoothing is being introduced; for example, with 5
seconds, first a 5-second average value is calculated which is then used to search for the minimum
and maximum values. This gives less sensitivity to instantaneous changes of the measured value.
Note: similarly to the averaging times shorter than 10 seconds, the 200 ms, 1 s, 3 s and 5 s times
are actually the multiples of the mains period - 10/12, 50/60, 150/180 and 250/300 mains periods,
respectively.
Selecting the right averaging period is not easy. To a large extent it depends on the type of
disturbance in the system and the user's expectations for the final data analysis. A frequent situation
is that we know only that there is a problem in the mains, and the measurements with the analyzer
will only help us identify the cause. In this situation it is better to use shorter averaging times (e.g.
10 seconds), and activate the recording of minimum and maximum values (for the voltages and
currents it is advisable in such situation to set the shortest possible time for determining the maxi-
mum and minimum value, i.e. half the period). Short time averaging will give more precise diagrams
of changes of parameters over time, and minimums and maximums will be detected and recorded.
Recording with short averaging times is performed mostly for limited time, primarily due to rapid
growth of data; the air of such recording is identifying the possible cause of a problem, and not a
long-term analysis.
Recording with a short averaging time may be sufficient to evaluate the performance of the
mains and disturbances in it. However, equally detailed information can probably also be obtained
with longer times (in minutes) but with activated recording of minimum and maximum values and
event detection. An important advantage in this situation is that the volume of recorded data is much
smaller which means faster data retrieval and analysis.
Summary of Contents for PQM-700
Page 85: ...85 Notes...


