page 4 / 8
Data analysis
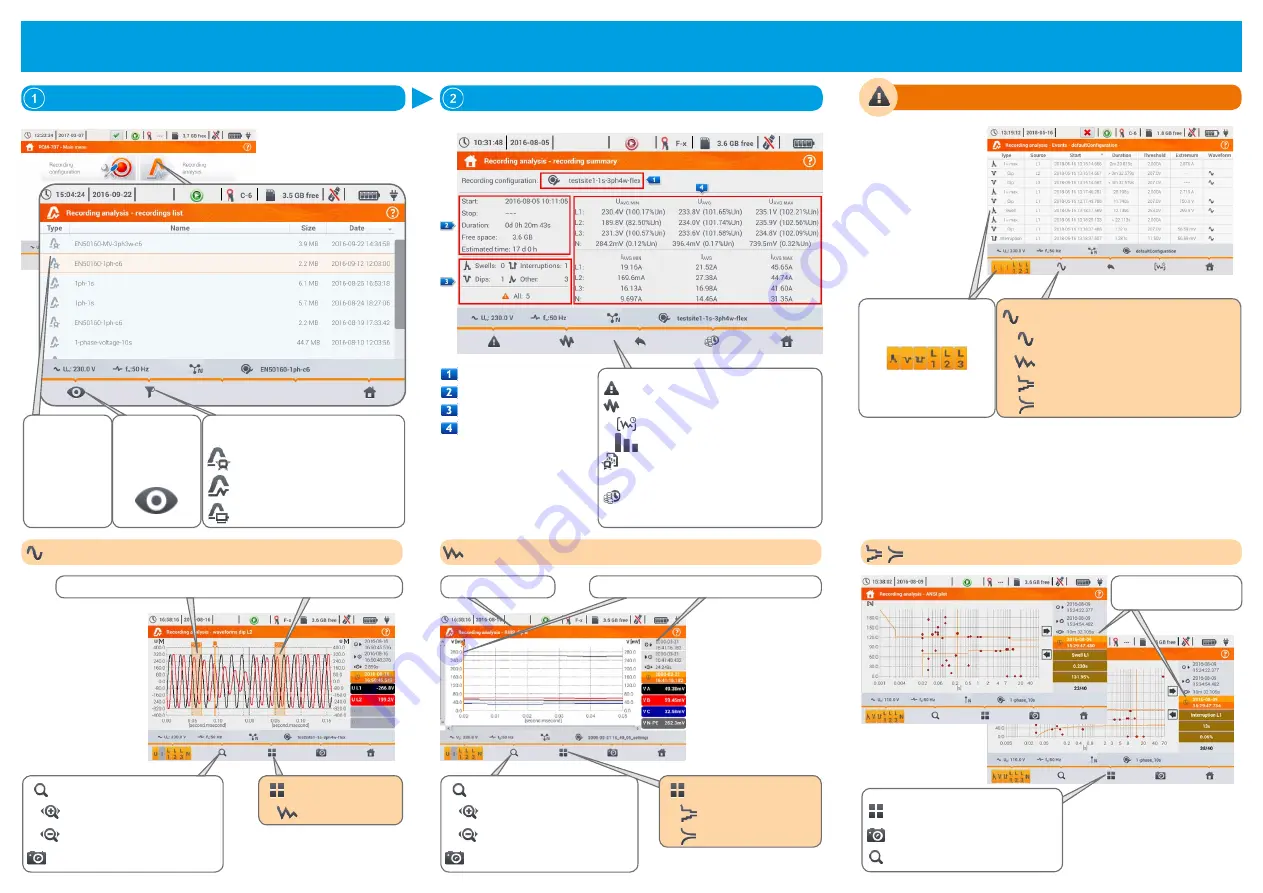
List of recorded measurements
Recording summery window
Configuration name
History of recording
Statistics of events
Statistics of Voltage
and Amps measure-
ment
go to list of events
go to plots
timeplots
harmonics
go to standard report (only for config
-
uration acc. to standard)
go to energy costs calculator (only for
configuration acc. to user)
Analysis of events
go to a diagram of selected item
waveforms
RMS
1/2
plot
ANSI plot
CBEMA plot
▪
Swells
▪
Dips
▪
Interruptions
▪
I > max
▪
I < min
▪
U
DC
> max
▪
U
DC
< min
Filter the list using
and select an item
Waveforms
zoom of visible time window
zoom-in horizontally
zoom-out horizontally
screenshot
Select signals as
visible:
▪
U - voltages
▪
I - currents
▪
L1(A) - phase 1
▪
L2(B) - phase 2
▪
L3(C) - phase 3
▪
N - neutral
select view type
go to RMS
1/2
plot
Waveforms of beginning (
START
) and end (
STOP
) of event
RMS
1/2
plot
zoom of visible time window
zoom-in horizontally
zoom-out horizontally
screenshot
Select signals
to visualize:
▪
Ch 1
: V A, V A-B, I A
▪
Ch 2
: V A, V A-B, I B
▪
Ch 3
: V A, V A-B, I C
▪
Ch 4
: V N-PE, I N
select view type
go to ANSI plot
go to CBEMA plot
Marker
to view
details
at selected time
Reason
of event
Filtering the recordings
according to standard
according to user
inrush current
Analysis of
the selected
recording
Select a mea
-
surement file
from list
ANCI / CBEMA graph
select view type
screenshot
zoom of visible time window
Select type of event
to visualize


