page 5 / 8
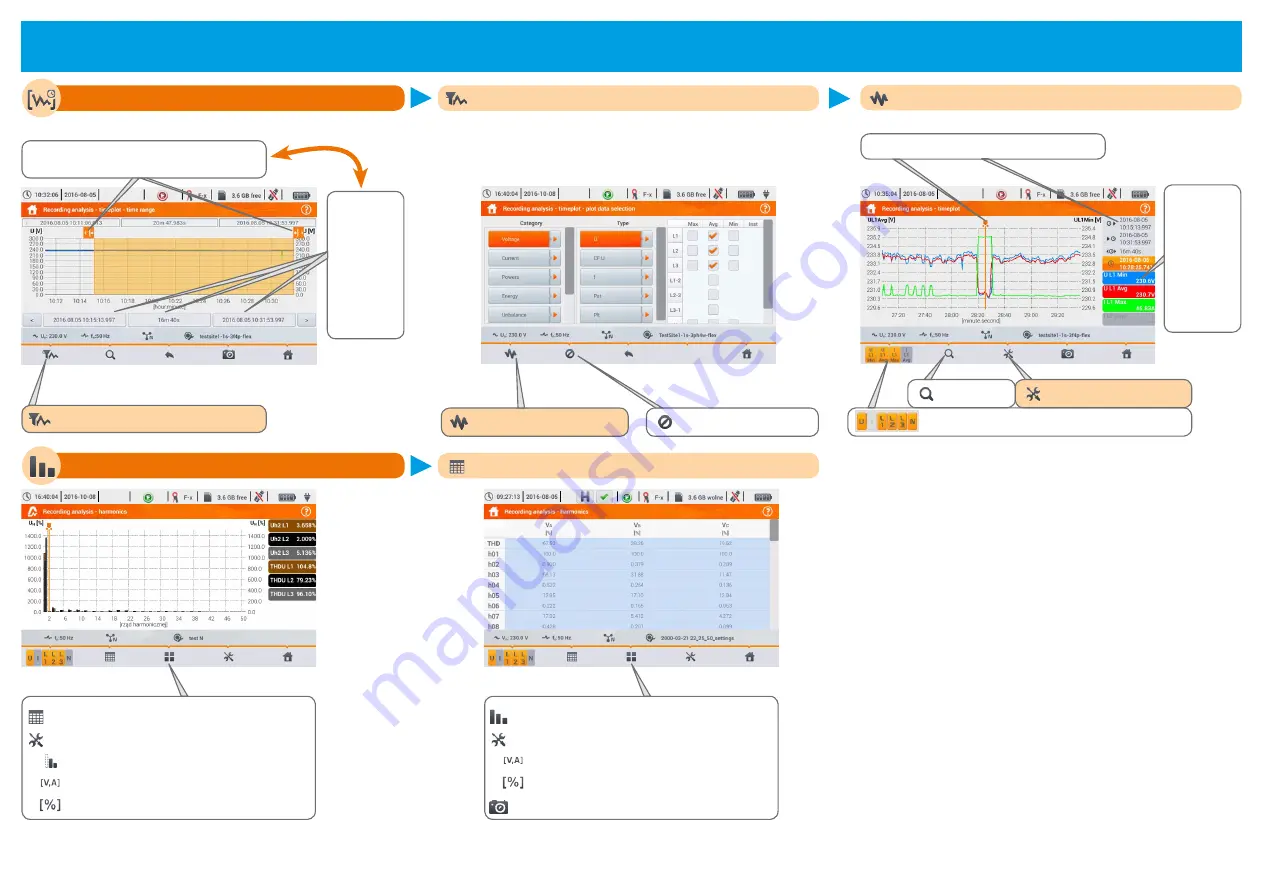
Timeplots
select parameters to view range
Move the markers to set the range of
analyzed data
Set:
▪
start time
▪
duration
▪
end time
Selection of timeplot data
removes all selections
Categories, types, classes:
▪
Max
- maximum in period
▪
Avg
- average in period
go to timeplot analysis
▪
Min
- minimum in period
▪
Inst
- instantaneous value
Recording analysis - timeplot
zoom menu
displays additional menu
Marker
to view
details
at selected time
Select for
visualization:
▪
Ch 1
▪
Ch 2
▪
Ch 3
▪
Ch 4
additional selecting displayed timeplots
Harmonics
Table of harmonics
switching to tabular view of harmonics
additional menu
hiding the fundamental harmonic
displaying in absolute units (volts and amps)
displaying in percent of fundamental
switching to bargraph
additional menu
displaying in absolute units (volts and amps)
displaying in percent of fundamental
screenshot
Data analysis
or


