SC5 Signal Conversion
Performance Measurements
•
61
Output stability and temperature dependence
12 hour stability
The stability of the output voltage is measured over 12 hours at a 10 seconds interval with AO1 connected to a
National Instruments 4071
PXI digital multimeter operated in DMM mode (7.5 digits). The measurement is
performed for output voltages of 0 V and +9.9 V. The internal temperature of the SC5 is also recorded, in order to
compare the drift of the output signal with the temperature coefficient determined below. The results of the 12 hour
measurement are shown below. The following settings were used for the measurement:
SC5
DMM
Measured output:
AO1
Mode of operation: DMM, AC volts
Output amplitude: 0 V and +9.9 V Range:
100 mV and 10 V
Resolution:
26 bit
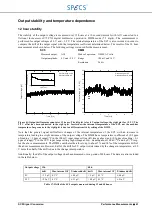
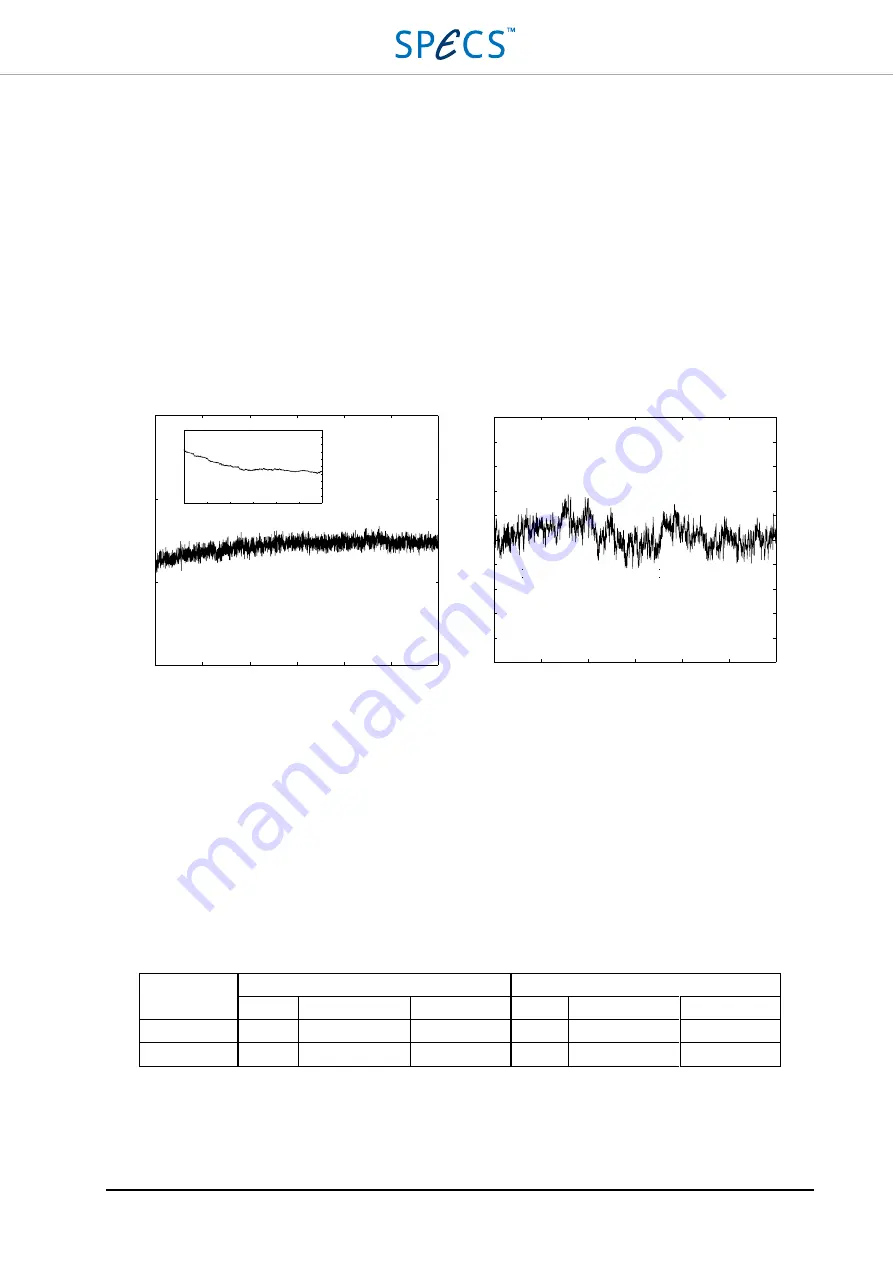
Figure 41: Output drift measurement over 12 hours. The left plot is for 0 V output voltage, the right plot for +9.9 V. The
9.9 V offset has been subtracted in the right plot. Insets show the internal temperature of the SC5, not the ambient
temperature. Larger noise in the right plot is due to a different sensitivity setting of the DMM.
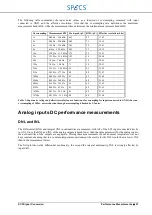
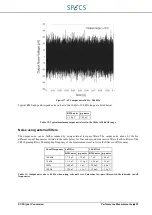
Note that the general signal drift reflects changes of the internal temperature of the SC5, with an increase in
temperature leading to a slight decrease of the output voltage. The DMM has a temperature coefficient of (0.3 ppm
of r 1 ppm of range)/°C in the 100 mV input range setting (left image above) and (0.3 ppm of r 0.1
ppm of range)/°C in the 10 V input range setting (right image above), meaning about 100 nV/°C and 4 µV/°C resp.
for the above measurements. The DMM contributes therefore to up to about 7% and 14% of the temperature drift of
the above measurements. However, half of the drift for 0 V output is determined by the change in temperature, at 9.9
V more than half of the drift is due to the change in temperature.
Additionally, the drift of the output voltages has been measured over a period of 48 hours. The data are also included
in the table below.
Output voltage 12 h
48 h
drift
Max. internal
Δ
T T-induced drift drift
Max. internal
Δ
T T-induced drift
0 V
< 1.5 µV 0.3 °C
≅
0.8 µV
< 5 µV 0.3 °C
≅
0.8 µV
9.9 V
< 25 µV 0.3 °C
≅
21 µV
< 40 µV 0.3 °C
≅
21 µV
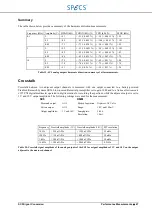
Table 17: Drift of the SC5 outputs measured during 12 and 48 hours.
0
2
4
6
8
10
12
0
6
12
Time [hrs]
Time [hrs]
O
ut
pu
tv
ol
ta
ge
[
μ
V]
Te
m
pe
ra
tu
re
[ºC
]
10
5
0
-5
41.5
41
40.5
Output range: ±10 V
Output voltage: 0 V
0
2
4
6
8
10
12
Time [hrs]
O
ut
pu
tv
ol
ta
ge
[
μ
V
-9
.9
V
]
50
40
30
20
10
0
-10
-20
-30
-40
-50
Output range: ±10 V
Output voltage: +9.9 V
Summary of Contents for Nanonis SC5
Page 1: ...Signal Conversion SC5 User Manual November 2016 R6860...
Page 2: ......
Page 5: ...SC5 Signal Conversion Conventions 5...
Page 8: ......
Page 72: ......
Page 74: ......
Page 75: ...SC5 Signal Conversion Legal Information 75 Declaration of Conformity...

