SC5 Signal Conversion
Performance Measurements
•
54
Analog outputs noise performance measurements
All measurements of the analog outputs, if not otherwise specified, were performed with hrDAC™ switched off.
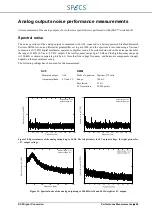
Spectral noise
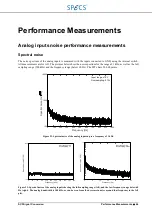
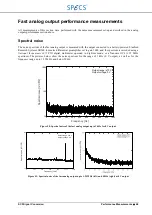
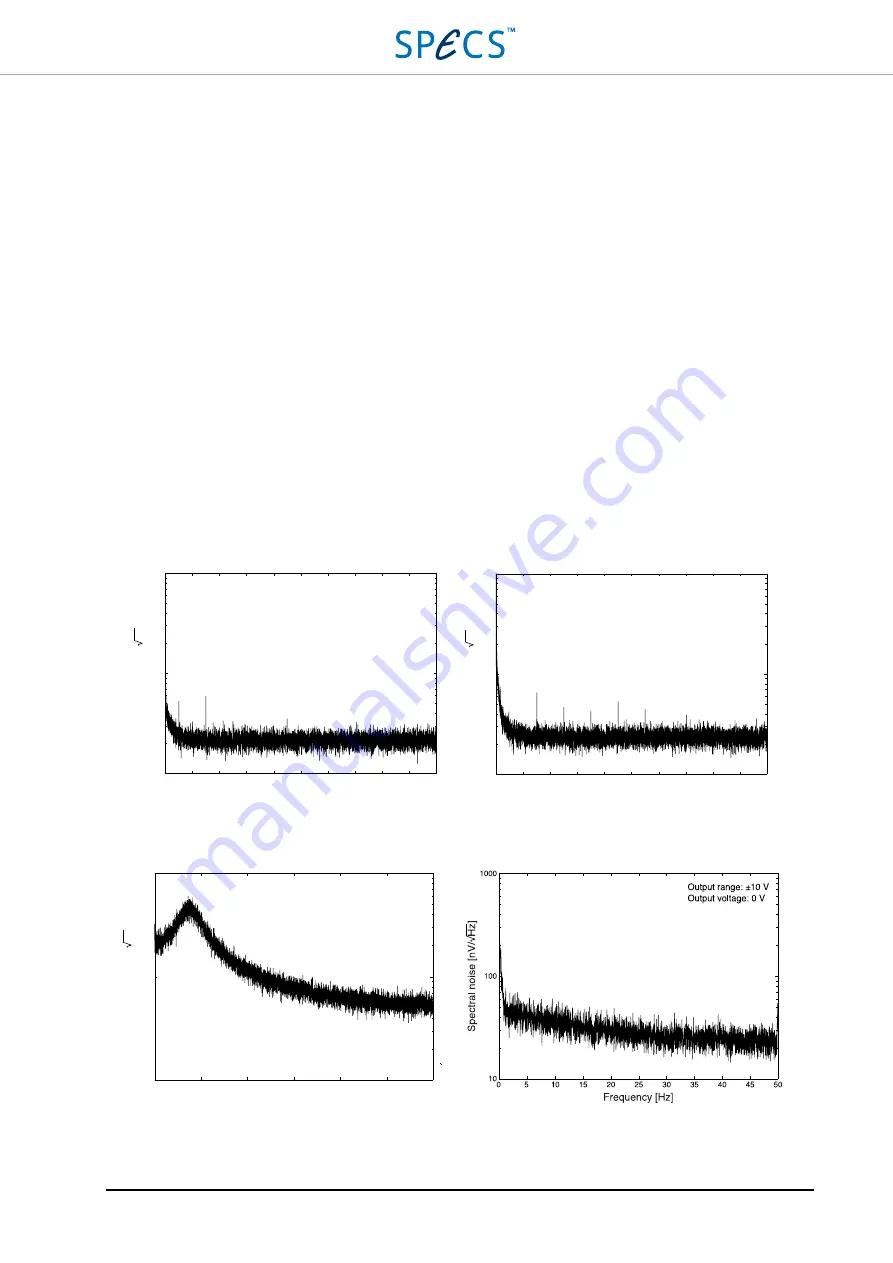
The noise spectrum of the analog outputs is measured with AO1 conneced to a battery-powered Stanford Research
Systems SR560 low-noise differential preamplifier set to gain 1000, and the spectrum is recorded using a
National
Instruments 4071
PXI digital multimeter operated in digitizer mode. The pictures below show the noise spectrum for
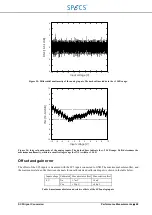
the range of 1 kHz (0 V and +9 V DC output). The low frequency range up to 50 Hz and the high frequency range up
to 300 kHz is shown in separate plots below. Note that line voltage frequency and harmonic components strongly
depend on the measurement set-up.
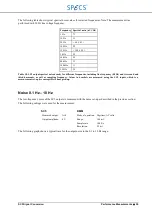
The following settings have been used for the measurement:
SC5
DMM
Measured output:
AO1
Mode of operation: Digitizer, DC volts
Output amplitude: 0 V and 9 V
Range:
100 mV
Resolution:
22 bit
FFT resolution
20’000 points
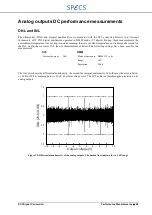
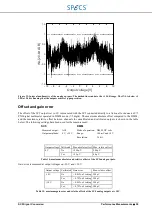
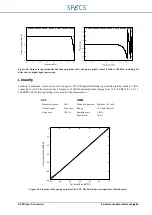
Figure 34: Spectral noise of the analog outputs up to 1 kHz. The left picture is for 0 V output voltage, the right picture for
+9 V output voltage.
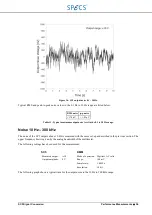
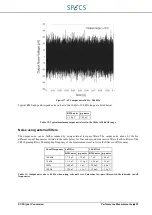
Figure 35: Spectral noise of the analog outputs up to 300 kHz (left) and 50 Hz (right) at 0 V output.
0
100
200
300
400
500
600
700
800
900
1000
Frequency [Hz]
Sp
ec
tra
ln
oi
se
[n
V
/
H
z]
1000
100
10
Output range: ±10 V
Output voltage: 0 V
0
100
200
300
400
500
600
700
800
900
1000
Frequency [Hz]
S
pe
ct
ra
ln
oi
se
[n
V
/
H
z]
Output range: ±10 V
Output voltage: +9 V
1000
100
10
Output range: ±10 V
Output voltage: +9 V
0
50
100
150
200
250
300
Frequency [kHz]
Sp
ec
tra
ln
oi
se
[n
V
/
H
z]
100
10
1
Output range: ±10 V
Output voltage: 0 V
Summary of Contents for Nanonis SC5
Page 1: ...Signal Conversion SC5 User Manual November 2016 R6860...
Page 2: ......
Page 5: ...SC5 Signal Conversion Conventions 5...
Page 8: ......
Page 72: ......
Page 74: ......
Page 75: ...SC5 Signal Conversion Legal Information 75 Declaration of Conformity...

