SC5 Signal Conversion
Performance Measurements
•
55
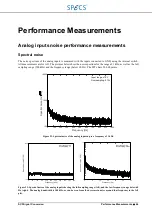
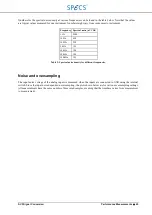
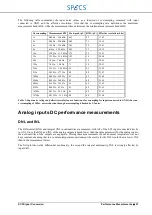
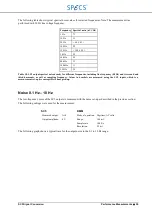
The following table shows typical spectral noise values for selected frequencies. Note: The measurement was
performed with 50 Hz line voltage frequency.
Frequency Spectral noise (nV/
√
Hz)
1 Hz
75
10 Hz
35
50 Hz
< 60 (< 45)
100 Hz
22
150 Hz
< 100 (< 90)
1 kHz
22
10 kHz
24
40 kHz
35
100 kHz
11
1 MHz
30
Table 10: SC5 output spectral noise density for different frequencies, including line frequency (50 Hz) and its second and
third harmonic, as well as sampling frequency. Values in brackets are measured using the SC5 inputs, which is a
measurement set-up less susceptible to hum pick-up.
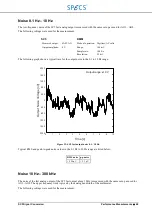
Noise 0.1 Hz – 10 Hz
The low-frequency noise of the SC5 outputs is measured with the same set-up as described in the previous section.
The following settings were used for the measurement:
SC5
DMM
Measured output:
AO1
Mode of operation: Digitizer, AC volts
Output amplitude: 0 V
Range:
100 mV
Sample rate:
100 S/s
Resolution:
22 bit
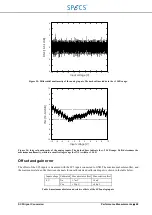
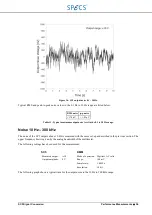
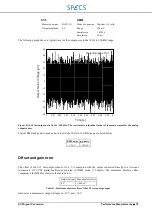
The following graph shows a typical trace for the output noise in the 0.1 to 10 Hz range:
Summary of Contents for Nanonis SC5
Page 1: ...Signal Conversion SC5 User Manual November 2016 R6860...
Page 2: ......
Page 5: ...SC5 Signal Conversion Conventions 5...
Page 8: ......
Page 72: ......
Page 74: ......
Page 75: ...SC5 Signal Conversion Legal Information 75 Declaration of Conformity...

