MCD Calibration
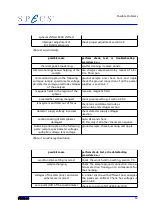
6. Check to see if the differences and the peak
position are reasonable. If the calculation
failed; check that the peak position can be
calculated for all regions. Mostly, regions
with low count rates (low pass energies) fail.
Move this region into another group and try
again (Drag and drop of the region via
mouse in the Files window). If you want to
check which region is causing the problems,
test that each single channel for the region
are able to perform the calculation (switch off noisy/wrong channels of the re-
gion and check if the peak location with “Tools”: “Peak Location” work, if work
also MCD calibration will work).
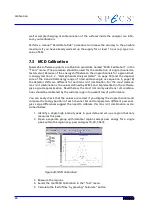
7. Pressing the apply button will apply the calculated shifts to all chosen slit com-
bination. The default values (registry entries) will be overwritten.
7.4 Work Function Calibration with UPS
UV excitation recommended. Please note the comments given in the section 3.6 “Work
Function” on page 34. Thermal, aging, or other effects can change the coating of the
analyzer and therefore the workfunction over time. Grounding the sample and the
power supply influence the work function as well. The default workfunction value can
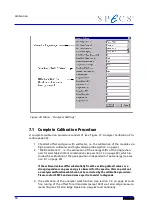
be corrected in the software in the Menu ’Analyzer/Settings’, see Figure 26. If you are in
doubt about the accuracy of the power supply it is recommended to perform the test /
calibration described in section "" on page first. Note the voltage range used while
measuring;: 40V, 400V, 1500V or 3500V (see SpecsLab2 menu ’Analyzer/Settings’).
1. Warm up the HSA3500 at least 10min. Switch off and on again to reboot and
force a startup calibration or manually perform the recalibration of the DACs
2. Set the voltage range for the UPS measurement mode in the Menu
’Analyzer/Settings’, see Figure 26, to 40V.
3. Switch to the binding energy scale. Measure the position of the fermi edge (e.g.
+0.2 to -0.2 eV binding energy, and select HeI (if He I of course is used) in the
dummy source of the Menu ’Analyzer/Settings’
Sources selected). (The tool Op-
eration/Fermi Edge in the SpecsLab2 program as well as the cursor and differ-
ence cursor cross (black/red cross icon, left/right mouse button) simplifies the
procedure.)
4. Calculate the energy difference between expected and measured fermi edge.
5. Note that the high precision measurement with the digital voltmeter for offset
and gain are considered as correct and therefore, especially for the 40 V mod-
ule, no further change for offset and gain is recommended. Once the measured
values for this range are correct, than it is possibile to estimate the work func-
tion.
Correct the default work function value in the Menu ’Analyzer/Settings’.
If the measured difference should be larger than 50meV perform the measure-
ment as described in section , "" on page and change the values. Note that
61
Summary of Contents for PHOIBOS 100
Page 1: ...PHOIBOS Hemispherical Energy Analyzer Series PHOIBOS 100 PHOIBOS 150 3 1...
Page 6: ...Table of Contents PHOIBOS...
Page 10: ...Introduction 4 PHOIBOS...
Page 13: ...Electrical Connections Figure 2 Connection Scheme PHOIBOS 7...
Page 14: ...Components and Connections Figure 3 Analyzer Housing PHOIBOS100 8 PHOIBOS...
Page 15: ...Electrical Connections Figure 4 Analyzer Housing PHOIBOS150 PHOIBOS 9...
Page 42: ......
Page 51: ...SpecsLab Hardware and Software Installation PHOIBOS 45...
Page 52: ......
Page 62: ......
Page 78: ...Analyzer Checks Figure 33 Schematics of the 12 pin Analyzer Feedthrough 72 PHOIBOS...
Page 80: ......
Page 86: ......
Page 92: ...List of Figures Figure 39 Alignment Pin 84 II PHOIBOS...
Page 93: ...List of Figures PHOIBOS III...
Page 94: ......
Page 96: ......
Page 98: ...Index PHOIBOS...

