background image

Hemispherical Analyzer (HSA)

natural line width of the characteristic radiation used for excitation 

E

photo 

(e.g. 

Mg, K

α

, Al K

α

).

The observed total FWHM

total 

is given by the convolution of the single FWHMs, e.g for 

gaussian line widths.

FWHM

total

=

E

an

2

E

level

2

E

photo

2

1

/

2

=

E


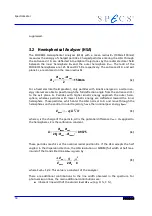
(6)

FWHM

total  

is usually specified using a sputter-cleaned silver sample and recording the 

Ag 3d

5/2 

level, after linear background subtraction. For Mg K

α 

excitation, the resolution 

at low HSA pass energies for the Ag 3d

5/2 

level is found to be

HM

Mg K

=

0.8

eV


(7)

In most practical work, a resolution of 0.9 eV is usually sufficient for high resolution in-

vestigations. For higher instrumental resolution, it is possible to use monochromatized 
X-radiation for excitation, e.g. mainly monochromatized Al K

α  

radiation. For mono-

chromatized Al K

α 

radiation and for the Ag 3d

5/2 

level, the extreme resolution is found 

to be

FWHM

extreme

=

0.44

eV


(8)

To obtain the extreme resolution of 0.44 eV, the FWHM of the X-ray has to be heavily 
restricted, by utilizing only a small part of the X-ray monochromator spot area (due to 

the energy dispersion across the spot area), at the expense of a strong loss in intensity. 
In practice, a resolution of 0.65 eV is usually sufficient for high resolution investigations 
with monochromatized Al K

α  

excitation. For monochromatic radiation, FWHM

total  

is 

sometimes specified recording the Si 2p

3/2


level instead of the Ag 3d

5/2

 level, which res-

ults in smaller values of FWHM

extreme. 

due to the narrower inherent line width of the Si 

2p level.

The integral signal intensity I of the measured particles (the area under the peak with a 
background subtracted) is proportional to product of the accepted solid angle 

S

, the 

accepted sample area A

S


and the HSA resolution 

E

an

:

I

~

E

an

S

A

S

=

E

an

0

A

0

E

pass

E

kin

~

E

pass

2

E

kin


(9)

where 

0


and A

0


are the values of the acceptances for the HSA. They are analyzer con-

stants. The equation results from Liouville’s theorem

1

.

The analyzer can be operated in two different modes:

a) Fixed Retarding Ratio (FRR), the retardation ratio R is defined as

1

For more information there are some excellent publications on analyzers. We recommend two of them:

K. D. Sevier, Low Energy Electron Spectrometry, Wiley-Interscience, 1972

D. Roy and D. Tremblay, Design of Electron Spectrometers, Rep. Prog. Phys. 53, 1621-1674,1990

PHOIBOS

19

Summary of Contents for PHOIBOS 100

Page 1: ...PHOIBOS Hemispherical Energy Analyzer Series PHOIBOS 100 PHOIBOS 150 3 1...

Page 2: ...nual for the Hemispherical Energy Analyzer Series PHOIBOS 100 150 Version 3 1 revised 19 November 2008 SPECS order number for this manual 78 000 101 PHOIBOS SPECS GmbH Surface Analysis and Computer Te...

Page 3: ...al Chambers 21 3 3 2 Trim Coil 21 3 4 Slit Orbit Mechanism 22 3 5 Single and Multichannel Detector SCD MCD 25 3 5 1 Principles of Detection 25 3 5 2 Coherence of Epass and Step 26 3 5 3 Electron Multi...

Page 4: ...on 57 7 1 Complete Calibration Procedure 58 7 2 Recalibrate the DAC Precision 59 7 3 MCD Calibration 60 7 4 Work Function Calibration with UPS 61 7 5 Work Function Calibration with XPS 62 7 6 Offset C...

Page 5: ...ask example for MCD9 78 9 3 2 2 Mask example for MCD5 79 10 Spare Parts 81 10 1 Cu Gasket 81 10 2 Multiplier 81 10 2 1 Channeltron Handling and Storage 81 10 2 1 1 Handling of the Multiplier 81 10 2 1...

Page 6: ...Table of Contents PHOIBOS...

Page 7: ...5 keV The PHOIBOS series of hemispherical analyzers are hemispherical deflectors available in two sizes 100mm or 150 mm mean radii The input lens is designed to accommodate a wide range of application...

Page 8: ...d spatially resolved studies All lens modes can be set electronically A Slit Or bit mechanism and a Multi Mode Lens make the sampling area of the analyzer and the acceptance angle area of the lens sel...

Page 9: ...them strictly Some adjustments that have to be performed in this manual are dangerous At each point these are indicated by a warning label Warning Tests to be performed on the electronic unit are with...

Page 10: ...Introduction 4 PHOIBOS...

Page 11: ...pply for PHOIBOS analyzer fully remote controlled and the following additional parts 1 Mounting instructions 2 Manual Safety Instructions 3 Manual PHOIBOS 4 Manual SpecsLab2 5 Manual CasaXPS 6 Second...

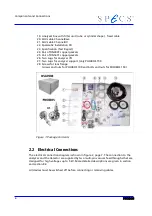
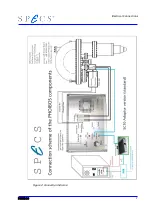
Page 12: ...support only PHOIBOS 150 28 Screws for lens flange screws and nuts for PHOIBOS 100 and bolts and nuts for PHOIBOS 150 Figure 1 Package Contents 2 2 Electrical Connections The electrical connection dia...

Page 13: ...Electrical Connections Figure 2 Connection Scheme PHOIBOS 7...

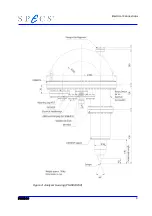
Page 14: ...Components and Connections Figure 3 Analyzer Housing PHOIBOS100 8 PHOIBOS...

Page 15: ...Electrical Connections Figure 4 Analyzer Housing PHOIBOS150 PHOIBOS 9...

Page 16: ...ector voltage UChannelBase U0 conversion voltage LA LE lens potentials IH OH inner outer hemisphere T1 to T10 electrodes of the multi mode transfer lens S1 hemispherical capacitor entrance slit S2 hem...

Page 17: ...on lens system and a slit Both the electron lens system and the slits sizes entrance and exit have an effect on the energy spread detected by the analyzer The input lens system Figure 5 Analyzer Main...

Page 18: ...h the capacitor output plane S2 are accelerated onto the detector system C With the multichannel detector each channel is connected to a separate preamplifier mounted outside the vacuum The preamplifi...

Page 19: ...DS is in principle given by equation 1 However due to spherical aberration of the input lens the image in the plane of the entrance slit is diffused The degree of diffusion increases for a fixed magni...

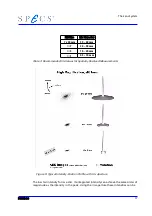
Page 20: ...ng the High Magnification Mode and the Iris aperture The magnification modes were optimized to allow very large acceptance angles for high transmission from point sources Point Transmission Modes In t...

Page 21: ...solved Medium Area mode electrons leaving the sample within a given angular range are focused onto the same location of the analyzer entrance inde pendent of their position on the sample The angular m...

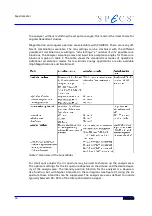
Page 22: ...ows the standard lens modes of operations Additional acceleration modes for low kinetic energy applications are also available HighMagnification2 and SmallArea2 Table 2 Overview of the Lens Modes For...

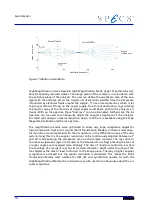
Page 23: ...ended Iris Values for Spatially Resolved Measurements Figure 9 Typical Intensity Position Profile with Iris Aperture The low tail intensity forms a disc Its integrated intensity can achieve the same o...

Page 24: ...energy approach the outer hemi sphere whereas particles with lower kinetic energy are deflected toward the inner hemisphere Those particles which enter the HSA normal to S1 and move through the hemisp...

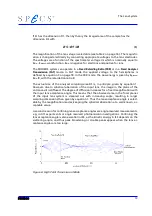
Page 25: ...area due to the energy dispersion across the spot area at the expense of a strong loss in intensity In practice a resolution of 0 65 eV is usually sufficient for high resolution investigations with mo...

Page 26: ...or the measurement of a survey spectrum The FAT mode is mainly used in XPS and UPS when detailed information is needed and the resolution should not be dependent on the energy If Ekin is kept constant...

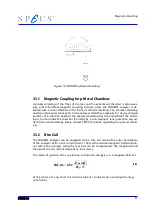
Page 27: ...ield ing is too far inside the chamber normally by a non magnetic lens protection cap ad ded to the lens shielding Please contact SPECS for advice regarding the metal shield ing 3 3 2 Trim Coil The PH...

Page 28: ...SA 3500 is equipped with a current module the con trol software allows the setting of the coil current In all programs the coil current set ting can be found in the analyzer settings menu as an additi...

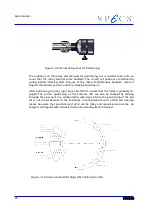
Page 29: ...ee Figure 12 External Rotary Dial for Positioning page 24 The exit slit positions are indicated by letters A B or A B and C These indicators correspond to those which appear in the region settings of...

Page 30: ...After positioning the dial jog it back and forth to ensure that the index is probably en gaged The correct positioning of the entrance slits can also be checked by looking through the view port In a c...

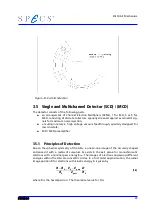
Page 31: ...ed for low cross talk SCD MCD preamplifier 3 5 1 Principles of Detection Due to the spherical symmetry of the HSA a one to one image of the circularly shaped entrance slit with a radius of curvature R...

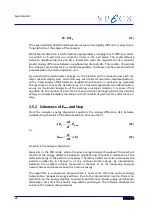
Page 32: ...ion 16 the number of particles from each channel belonging to the same kinetic energy can simply be added resulting in a total number of particles for each kinetic en ergy 3 5 2 Coherence of Epass and...

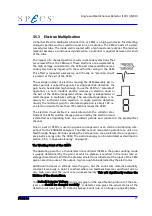
Page 33: ...lectrons leaves the CEM The electron cloud emitted is accelerated onto the collector elec trode of the CEM and the charge pulse carried by the electron cloud is detected as originating from one incide...

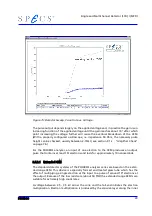
Page 34: ...channel should be displayed The start value for the detector voltage for counting depends on total number of accumulated counts see section 3 5 3 1 Extended CEM on page 29 and the threshold level of...

Page 35: ...nalyzer an input of one electron to the CEM produces an output pulse that contains at least 107 electrons and lasts for approximately 10 nanoseconds 3 5 3 1 Extended CEM The standard detector systems...

Page 36: ...conditioning Once properly conditioned or burned in the surface on the semiconducting glass channel is quite stable The test results suggested that accumulations to 5 1012 counts and higher can be exp...

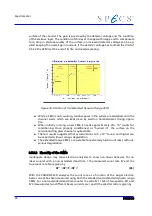
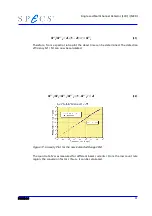
Page 37: ...ime can be determined The detection efficiency N 1 N1 can now be calculated N 1 N 1 N 1 N 2 1 N 2 A 22 Figure 17 Linearity Plot for the new Extended Range CEM The count rate N was measured for differe...

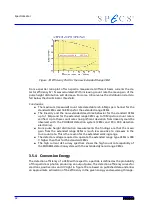
Page 38: ...observed with the PHOIBOS detection system CEMs and PCU 300 detection electronics From pulse height distribution measurements the findings are that the mean gain from the extended range CEMs is much l...

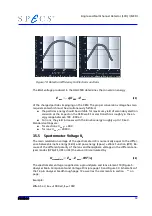
Page 39: ...rgy roughly up to 10 keV Standard settings are for electrons UBIAS 90 V for ions UBIAS 2000 V 3 5 5 Spectrometer Voltage U0 The main retardation voltage of the spectrometer U0 is numerically equal to...

Page 40: ...ns is given by E bin h E kin W f sample 25 The energy E kin see figure 20 is measured by the spectrometer and after calibrating the work function of the spectrometer the binding energy of the sample r...

Page 41: ...csLab2 program Adjust the desired voltage ranges separately select the voltage range in the analyzer settings before the measurement Please take note of section 7 4 Work Function Calibration with UPS...

Page 42: ......

Page 43: ...system Take great care when unpacking to prevent damage Do not rest the analyzer on the ceramic feedthroughs lens or the viewport Handle parts on the vacu um side of the flange seals using normal UHV...

Page 44: ...f the detector assembly with the corresponding hole in the ground plate see fig ure 21 Be sure that the detector is nearly parallel to the ground plate and push the de tector carefully into its seat W...

Page 45: ...perative that all users are aware of the issue and take the necessary precautions During first use after bake out rapid desorption of surface adsorbed gas will oc cur from the walls of the channel ele...

Page 46: ...d possible degradation 4 4 Alignment Non shielded chambers need no special modification of the lens protection analyzer shielding For shielded chambers the shielding needs a good physical connection t...

Page 47: ...any sensor is discolored please inform SPECS immediately and await further instructions 3 Remove the shipping frame 4 Carefully lift the analyzer out of the box Be aware of outstanding parts while pu...

Page 48: ...e analyzer mounting flange and prepare the necessary mounting parts screws for PHOIBOS100 washers and nuts 9 Insert a new DN100CF copper gasket into the vacuum chamber flange 10 Center the analyzer mo...

Page 49: ...he chamber to a pressure of below 10 5 Pa 10 7 mbar and bake out see section 4 6 Baking Out on page 43 19 Check the vacuum before and after bakeout 20 Connect the analyzer as described in the analyzer...

Page 50: ...7 Electronic Units Installation The electronic units have to be installed into a 19 cabinet rack Good air circulation within the cabinet must be ensured For wiring of the electronics follow figure 2...

Page 51: ...SpecsLab Hardware and Software Installation PHOIBOS 45...

Page 52: ......

Page 53: ...umn Udet with the default detector voltage menu Analyzer Settings A monthly check of this parameter see figure 15 page 29 is recommended 5 2 Quick Start 1 Check vacuum conditions 2 Check sample 3 Swit...

Page 54: ...ary dial is internally fixed near to the right value by a physical rest position Please check the marking at the rotary for the desired combination Additionally a check via the viewport for alignment...

Page 55: ...ofiling with noble gas ions operation up to 10 6 mbar 10 4 Pa is allowed Adjust the detector voltage to the value corresponding to the Specification Report of the analyzer or check the actual value se...

Page 56: ...default set to 2000 see section 3 5 4 Conversion Energy on page 32 The excitation source should be degassed and run under proper conditions to avoid structures due to possible residual gas inside the...

Page 57: ...oses 6 1 Short Circuits Check the resistance of the pins on the HSA 12 pin figure 33 page 72 and detector figure 34 page 73 feedthroughs to ground and to each other to rule out short cir cuits It is e...

Page 58: ...n Ag sample photo current 0 2 0 3 nA W sample is dirty sputter until C and O peak in the spectrum disappears sample too rough remove roughness incorrect analyzer sample distance adjust distance to 40...

Page 59: ...ns system and HSA out of focus check lens and HSA electrodes section 8 4 and voltages section detector supply voltage incorrect check detector supply voltages section carbon coating of HSA spheres dam...

Page 60: ...Intensity Fluctuations possible cause perform check test or troubleshooting procedure no field emission at the exit slit of the HSA Background signal independent of Ekin with DE const rises with small...

Page 61: ...perform check test or troubleshooting procedure no malfunction of lenses Check tubus voltages section Check all ana lyzer HSA 3500 voltages on page The voltage can be measured either at the 12 pin fee...

Page 62: ......

Page 63: ...recalibration the accuracy of the energy scale can be sig nificantly improved table on page If energy shifts of well known peaks occur check the grounding of your sample There should be no potential d...

Page 64: ...7 3 on page 60 which in cludes the calibration of the peak position independent of pass energy see sec tion 8 1 on page 65 If the achieved values differ substantially from the existing default values...

Page 65: ...of offset and gain performed in the se lected range Figure 27 Analyzer Cailbration Procedure 7 2 Recalibrate the DAC Precision Note the power supply needs time to warm up A self calibration procedure...

Page 66: ...each lens slit combination For the most common lens slit combinations the values defined by SPECS and implemented in the software give a good approximation Nevertheless the most commonly used lens sl...

Page 67: ...s recommended to perform the test calibration described in section on page first Note the voltage range used while measuring 40V 400V 1500V or 3500V see SpecsLab2 menu Analyzer Settings 1 Warm up the...

Page 68: ...te that you have to select at least the 1500V range see SpecsLab2 menu Analyzer Settings in case of Mg Al Kalpha excitation This voltage ranges has a lower accuracy than the 40V range on page 7 6 Offs...

Page 69: ...cursor and differ ence cursor cross black red cross icon left right mouse button simplifies the procedure 4 Note the comments given in section 7 4 Work Function Calibration with UPS on page 61 5 Use...

Page 70: ...d the copper peak use clean samples sputtered Measure the distance between the peak maxima of gold and copper If the value found differs strongly from 848 66 eV please inform SPECS You can correct the...

Page 71: ...voltages are cor rect the peak maxima of both spectra have to have the same energy The peak posi tions of both spectra should not differ by more than 100 meV For a symmetrical peak the peak position...

Page 72: ...consistently check if the proper peak position can be achieved by correcting the Work Function sections 7 4 Work Function Calibration with UPS on page 61 7 5 Work Function Calibration with XPS on pag...

Page 73: ...sample is introduced into the vacuum chamber and cleaned by ion sput tering Use the same settings as in the overview spectrum of silver enclosed with the Specification Report on the analyzer For exam...

Page 74: ...ity and Resolution Use the same settings as in the Ag spectra enclosed with the Specification Report on the analyzer For example Excitation Mg K X ray power 300 W Slit entrance largest slit exit open...

Page 75: ...ult detector voltage If the measured spectra and values differ substantially from those in the Specification Report of the analyzer it may be necessary to sputter the sample again or optimize the samp...

Page 76: ...t counter the counter is defective or the spec trometer voltage U0 is missing The following checks should be made 1 All cable connections Figure 2 Connection Scheme page 7 between has 3500 and Detecti...

Page 77: ...OIBOS100 R6 or higher PIN 1 2 3 4 5 6 7 8 9 10 11 12 housing 60 191 139 63 124 71 79 396 109 303 Table 16 Capacitance Measurements pF PHOIBOS150 R6 or higher If the measured capacitances differ substa...

Page 78: ...Analyzer Checks Figure 33 Schematics of the 12 pin Analyzer Feedthrough 72 PHOIBOS...

Page 79: ...Connection Check of the Analyzer Electrodes Figure 34 Schematics of the 12 pin Detector Feedthrough 8 5 Check all analyzer voltages This section has been moved to the HSA3500 Manual PHOIBOS 73...

Page 80: ......

Page 81: ...nel Threshold Value Use the fixed mode of the acquisition software see SpecsLab2 manual to estimate the noise at constant kinetic energy for the acquired signal and compare with the square root of the...

Page 82: ...r power green LED Note If the maximum count rate is achieved the measurement will stop To avoid this increase the discriminator level to about 15mV or use a resistor of about 100 Ohm for the check The...

Page 83: ...neltron becomes noisy dust contamination overheated etc To avoid disturbing the acquisition of the other channeltrons increase the threshold level for this channel Figure 26 Menu Analyzer Settings pag...

Page 84: ...bit from the left is channel number 1 and the last to the right is channel 9 or 5 respectively Therfore all channels means HKEY_LOCAL_MACHINE SOFTWARE Specs Hsa3500Analyzer Phoibos Hsa3500 150 R5c Co...

Page 85: ...is channel number 1 and the last digit on the right side is channel 5 respectively Therfore all channel means HKEY_LOCAL_MACHINE SOFTWARE Specs Hsa3500Analyzer Phoibos Hsa3500 100 R5c CounterChannelMa...

Page 86: ......

Page 87: ...d Storage A channeltron or a channeltron array array of 5 or 9 of single channel multipliers fused together in a precision matrix is a high gain device for detecting energetic particles such as electr...

Page 88: ...ble long term storage medium The most effective long term storage condition for the channeltron is a clean oil free vacuum A dry box which utilizes an inert gas such as argon or nitrogen heated above...

Page 89: ...e screws of each channeltron a bit Remove the channeltron Put the new channeltron in place and rebuild in reverse order Carefully fasten the connections with the screws Note A bad contact means noisy...

Page 90: ...re that the detector is nearly parallel to the ground plate and push the detector carefully into its seat Figure 39 Alignment Pin Pump down Detector must be baked out at a vacuum pressure lower than 1...

Page 91: ...Figure 18 Efficiency Plot for the new Extended Range CEM 32 Figure 19 Detection Efficiency for Electrons and Ions 33 Figure 20 Energy Scheme Photoelectron Spectroscopy 34 Figure 21 Removal of the Tran...

Page 92: ...List of Figures Figure 39 Alignment Pin 84 II PHOIBOS...

Page 93: ...List of Figures PHOIBOS III...

Page 94: ......

Page 95: ...sity 53 Table 7 Low Energy Resolution 53 Table 8 Peaks Shifted Equally 54 Table 9 Peaks Shifted Differently 54 Table 10 Intensity Fluctuations 54 Table 11 High Background Signal 54 Table 12 Noisy Spec...

Page 96: ......

Page 97: ...eration 47 Functional Test 49 H Hemispherical Analyzer 18 High Background 54 Housing 8 I Intensity Fluctuations 54 Introduction 1 ISS Operation 50 L Lens System 12 lifetime 27p 30 49 Low Energy Resolu...

Page 98: ...Index PHOIBOS...

Page 99: ...s liquids evaporation products sputtering products Yes No toxic substances corrosive substances microbiological substances incl sample material radioactive substances incl sample material ionising par...

Reviews: