background image

3

INTRODUCTION

This Sper Scientific Integrating Sound Datalogger measures the sound 

pressure levels (SPL) according to the specified weighting and integrates 

the weighted SPL over an established length of time, such as an 8-hour 

workday, in order to measure accumulative sound exposure (Leq). Test 

parameters are simultaneously displayed on a large, bright, backlit 

display, featuring 0.1 dB resolution and a bar graph.  Up to 64,000 data 

records can be stored in the meter and saved, graphed, and processed 

on a computer through the USB interface and included software. The 

meter complies with IEC 61672:2013 Class 2 and ANSI S1.4:2014 Type 

2 meter standards.


FEATURES

•  IEC 61672:2013 Class 2 and ANSI S1.4:2014 Type 2 meter

• Digital and analog displays
• 20 Hz to 8 KHz frequency range
• 30 to 130 dB measuring range
• A/C frequency weighting
• Fast and slow time weighting
• 100 dB dynamic range
• 64,000 records
• Minimum and Maximum values
• Over- and under-limit alarms
•  AC/DC output

• Automatic shutoff (optional)

• Backlight

MATERIALS SUPPLIED

• Integrating Sound Datalogger
•   Windscreen
•   USB  cable

• Screwdriver

•  (4) 1.5V AA Bateries

•   Instruction  Manual
•  Hard carrying case

Summary of Contents for 850017

Page 1: ...Integrating Sound Datalogger 850017 Instruction Manual...

Page 2: ...do not yet exist or may be developed including photocopying recording or any information storage and retrieval system without the express permission from Sper Scientific INTRODUCTION 3 FEATURES 3 MATE...

Page 3: ...d saved graphed and processed on a computer through the USB interface and included software The meter complies with IEC 61672 2013 Class 2 and ANSI S1 4 2014 Type 2 meter standards FEATURES IEC 61672...

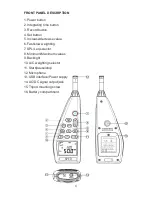
Page 4: ...Set button 5 Increase decrease value 6 Fast slow weighting 7 SPL Leq selector 8 Minimum Maximum values 9 Backlight 10 A C weighting selector 11 Start pause stop 12 Microphone 13 USB interface Power su...

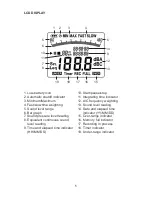
Page 5: ...continuous sound level reading 9 Time and elapsed time indicator HH MM SS 10 Start pause stop 11 Integrating time indicator 12 A C frequency weighting 13 Sound level reading 14 Date and elapsed time i...

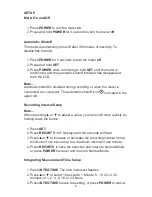
Page 6: ...mputer The automatic shutoff icon is located in the upper left Recording Interval Setup Note When pressing or to adjust a value you can scroll more quickly by holding down the button 1 Press SET 2 Pre...

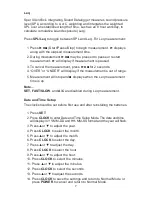
Page 7: ...t will stop and displays when the Leq measurement time is up Note SET FAST SLOW and A C are disabled during Leq measurement Date and Time Setup The clock should be set before first use and after reins...

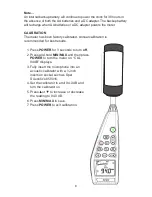
Page 8: ...nual calibration is recommended for best results 1 Press POWER for 3 seconds to turn off 2 Press and hold MIN MAX and then press POWER to turn the meter on CAL 94dB displays 3 Fully insert the microph...

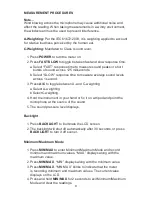
Page 9: ...oss 1 second 3 Press A C to toggle between A and C weighting a Select A weighting b Select C weighting 4 Hold the instrument in your hand or fix it on a tripod and point the microphone at the source o...

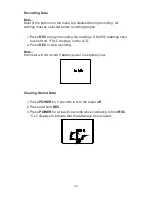
Page 10: ...adings If 64 000 readings have been stored FULL displays on the LCD 2 Press REC to stop recording Note the meter will not record if battery power is extremely low Clearing Stored Data 1 Press POWER fo...

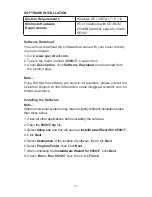
Page 11: ...ware you need is not available please contact our Customer Support at 480 948 4448 or email info sperscientific com for further assistance Installing the Software Note Different computer systems may r...

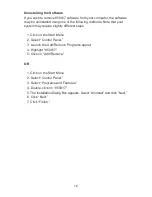
Page 12: ...may require slightly different steps 1 Click on the Start Menu 2 Select Control Panel 3 Launch the Add Remove Programs applet 4 Highlight 850017 5 Click on Add Remove OR 1 Click on the Start Menu 2 S...

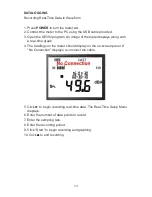
Page 13: ...splays along with a real time graph 4 The readings on the meter should display on the on screen panel If No Connection displays re connect the cable 5 Click to begin recording real time data The Real...

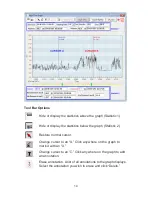
Page 14: ...low the graph Statistic 2 Restore normal cursor Change cursor to an X Click anywhere on the graph to mark it with an X Change cursor to an I Click anywhere on the graph to add an annotation Erase anno...

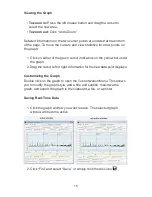
Page 15: ...ursor indicators on the yellow bar under the graph 2 Drag the cursor left or right Information for the new data point displays Customizing the Graph Double click on the graph to open the Customization...

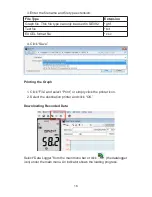
Page 16: ...file txt EXCEL format file csv 4 Click Save Printing the Graph 1 Click File and select Print or simply click the printer icon 2 Select the destination printer and click OK Downloading Recorded Data S...

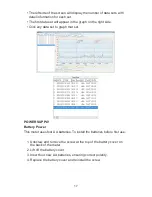
Page 17: ...Click any data set to graph that set POWER SUPPLY Battery Power This meter uses four AA batteries To install the batteries before first use 1 Unscrew and remove the screw at the top of the battery co...

Page 18: ...tor on the bottom of the meter CARE AND MAINTENANCE Keep the microphone dry Avoid exposing the unit to excessive vibration Do not store the instrument in high temperature or high humidity environments...

Page 19: ...t bar graph Resolution 2 dB Update rate 50 mS Datalogging Capacity 64 000 records AC Output 1 Vrms at full scale DC Output 10 mV dB Power Supply Four 1 5V AA alkaline batteries Power Life Approximatel...

Page 20: ...nty does not cover probes batteries battery leakage or damage resulting from accident tampering misuse or abuse of the product Opening the meter to expose its electronics will break the waterproof sea...

Reviews: