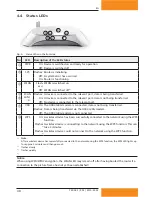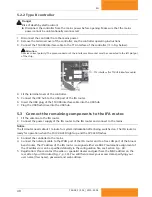
36
749.082 | Z02 | 2015-02-03
EN
3
4
6
5
1
2
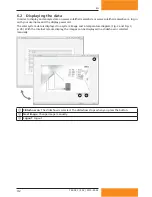
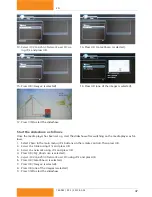
Fig. 2: System image
①
Current temperature at sensor
②
in
°C
or
°F
②
Sensor name, in this case
T1
③
Current thermal performance in
kW
or
Btu/h
1)
current time
④
Daily energy
1)
in
kWh
or
Btu
current date
Annual energy
1)
in
kWh
or
Btu
current year
Total energy
1) 2)
in
kWh
,
MWh
or
Btu
total
⑤
CO
2
savings
1) 3)
in
T
or
tn sh
CO
2
total
⑥
Only with the
System pressure monitoring
function: System pressure in
bar
or
psi
p
(
Ma-
nometer
symbol)
1)
Only with the Heat Quantity function
2)
Total cumulative value of the heat meter
3)
Calculation based on the total cumulative value of the calorimetry system and the following publi-
cations:
Europe
: Renewable energy sources in figures - national and international development; German Federal Ministry
for the Environment, European Nature Conservation and Nuclear Safety: CO
2
savings factor 232 g CO
2
/kWh
therm
.
North America / Canada
: Hawaiian Electric Co., Inc. HECO Residential Rebate Program, Solar water heating system
information sheet (2007): 1.918 Ibs CO
2
/kWh
therm
4
1
2
3
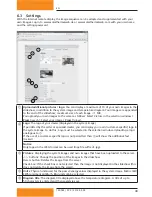
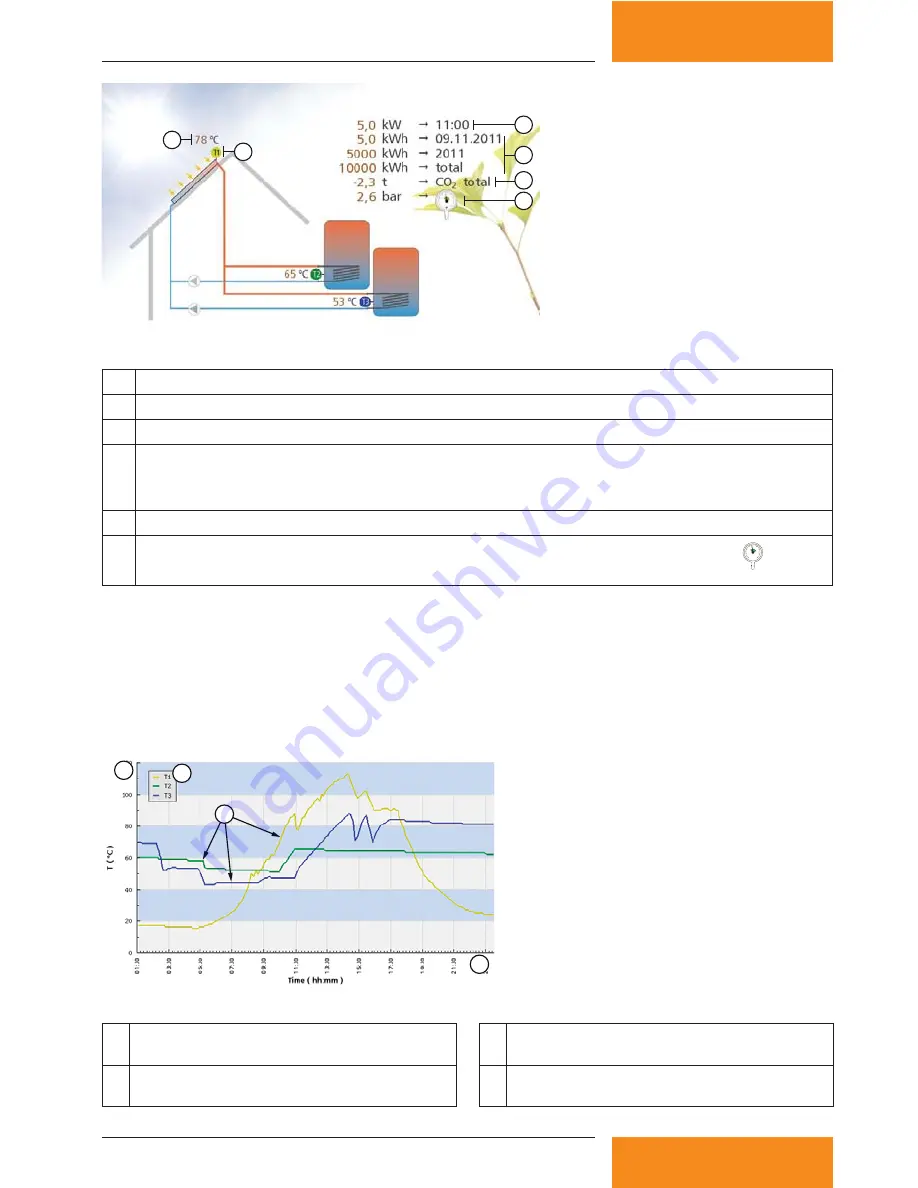
Fig. 3: Temperature diagram
①
Y axis: Temperature in °C or °F; automatically
scaled
③
Temperature curves for
T1
,
T2
and
T3
②
Legend, in this case with the sensors
T1
,
T2
and
T3
④
X axis: Time of day in the form
hh:mm
; auto-
matically scaled

