Diagnosis
Operation manual
ID 442233.05
WE KEEP THINGS MOVING
51
8
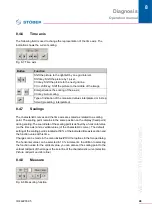
Fig. 8-11 View of a printed page
The axis switchover data are also shown graphically under the picture. Black bars
indicate when an axis was active (
E84
=0 to 3). Gray bars indicate selected but
inactive axes (
E84
=4 to 7). In the example shown in Fig. 8-12the area of the black
bar shows axis 1 as active.
Fig. 8-12 Bar diagram
Additional informationen
The following information is indicated in this area:
•
Allocation of the eight channels with address, designation, scaling (unit/div.)
and the identifier of an inverted presentation (INV) or a curve drawn to zero
(GND).
•
Scaling of the time axis (time unit/DIV).
•
Indication type:
Steps
or
Interpolated
.
•
Trigger condition and scanning time; pictures which were stored with an older
version of POSITool are provided with a note indicating this. They are printed
without information on scanning times and trigger conditions.
Any commentary which the options indicate is to be printed is shown in a box to
the right of the additional information.


