8
Diagnosis
ID 442233.05
WE KEEP THINGS MOVING
Operation manual
48
8.4.6
Time axis
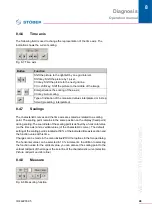
The following field is used to change the representation of the time axis. The
indication shows the current scaling.
Fig. 8-7 Time axis
8.4.7
Scalings
The characteristic curves and the time axis are scaled as related to a scaling
point. The scaling point remains in the same position on the display (fixed point)
during scaling. The coordinate of the scaling point is defined by a horizontal value
(on the time axis) and a vertical value (of the characteristic curve). The default
setting of the scaling point is located at 50 % of the indicated time axis section and
the function value at this time.
Changes can be made in the menu
Extras/POSITool options
in the
Scope
dialog.
The horizontal value can be selected in 10 % increments. In addition to selecting
the
function value
for the vertical value, you can also set the scaling point to the
vertical midpoint of the image or the zero line of the characteristic curve (selection
Picture midpoint and Zero line
).
8.4.8
Measure
Fig. 8-8 Measuring function
Button
Function
Shift the picture to the right/left by one grid interval.
Shift key: Shift the picture by 1 pixel.
Ctrl key: Shift the picture to the next grid line.
Ctrl + shift key: Shift the picture to the middle of the image
Enlarge/reduce the scaling of the x-axis;
Ctrl key: Auto scaling
Type of indication of the measured values interpolated or in step
format (presetting: interpolated).


