32
4.
Operation h Menu:
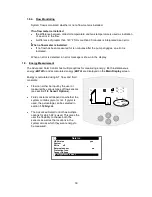
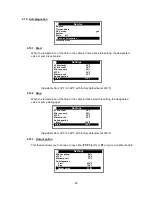
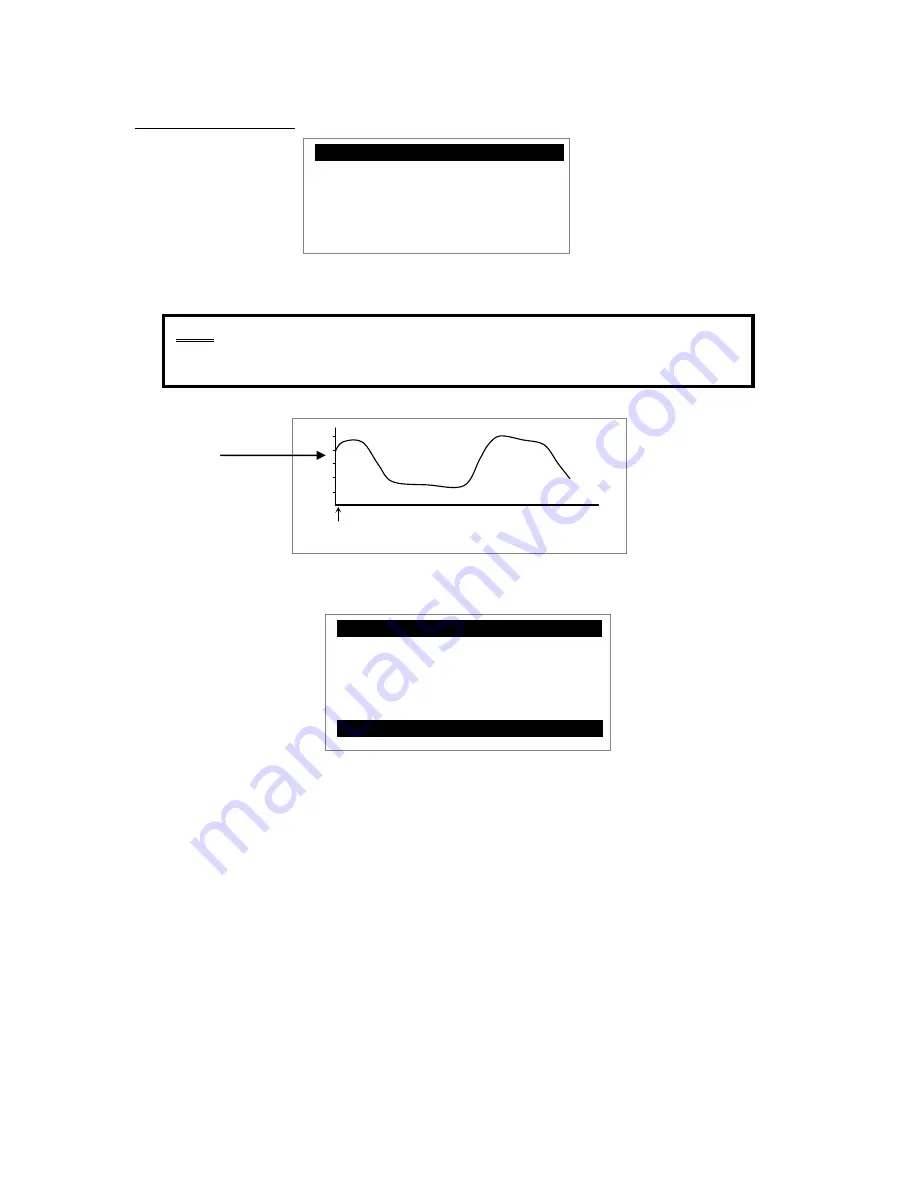
This menu offers both a data view and a graph view for the
Operation
,
dT
,
Power
and
Energy
values.
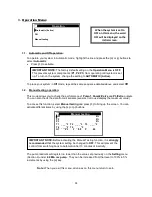
You can change the scale of these graphs on the
Service
menu under
Time graf op
.
Using the
(+)
or
(-)
buttons
,
select
Time graph op
and press
(>)
to highlight the line.
x
Now you can change the scale with the
(+)
or
(-)
buttons.
(Adjustable from 1 to 48 hours with factory default set at1 hour)
Press
(<)
repeatedly to return to the main menu.
¤¤
Operation h
------------------
¤
Operation
_ _ h
dT
_ _°F
Power
_ _kBTU/h
Energy
_ _kBTU
Volume
_ _Gallons
SD card
Off
¤¤
Service
--------- - --- --
Pump P1
PhAC SC
Pump P2
No SC
Glycol
no
Factory setting
no
Reset op time
no
Time graf temp
5m
£
Time graf op
1h
--
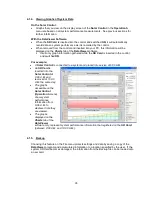
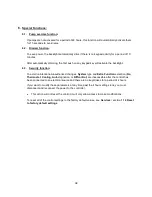
NOTE: WHEN VIEWING GRAPHS ON THE CONTROL DISPLAY
, the most current data
always displays on the left side of the graph; historical data scrolls to the right.
- +
0d 00h
Operation
0.0h
Current Data
Summary of Contents for ADVANCED SOLAR CONTROLLER
Page 1: ...ADVANCED SOLAR CONTROLLER...
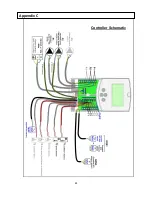
Page 41: ...41 Controller Schematic Appendix C...
Page 42: ...42 Appendix D...

