SunMaxx Solar | 5098 NY 206 Bainbridge NY 13733 | 1.877.786.6299 1.877.270.7875 fax | www.sunmaxxsolar.com
1. Measurement Values
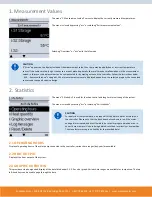
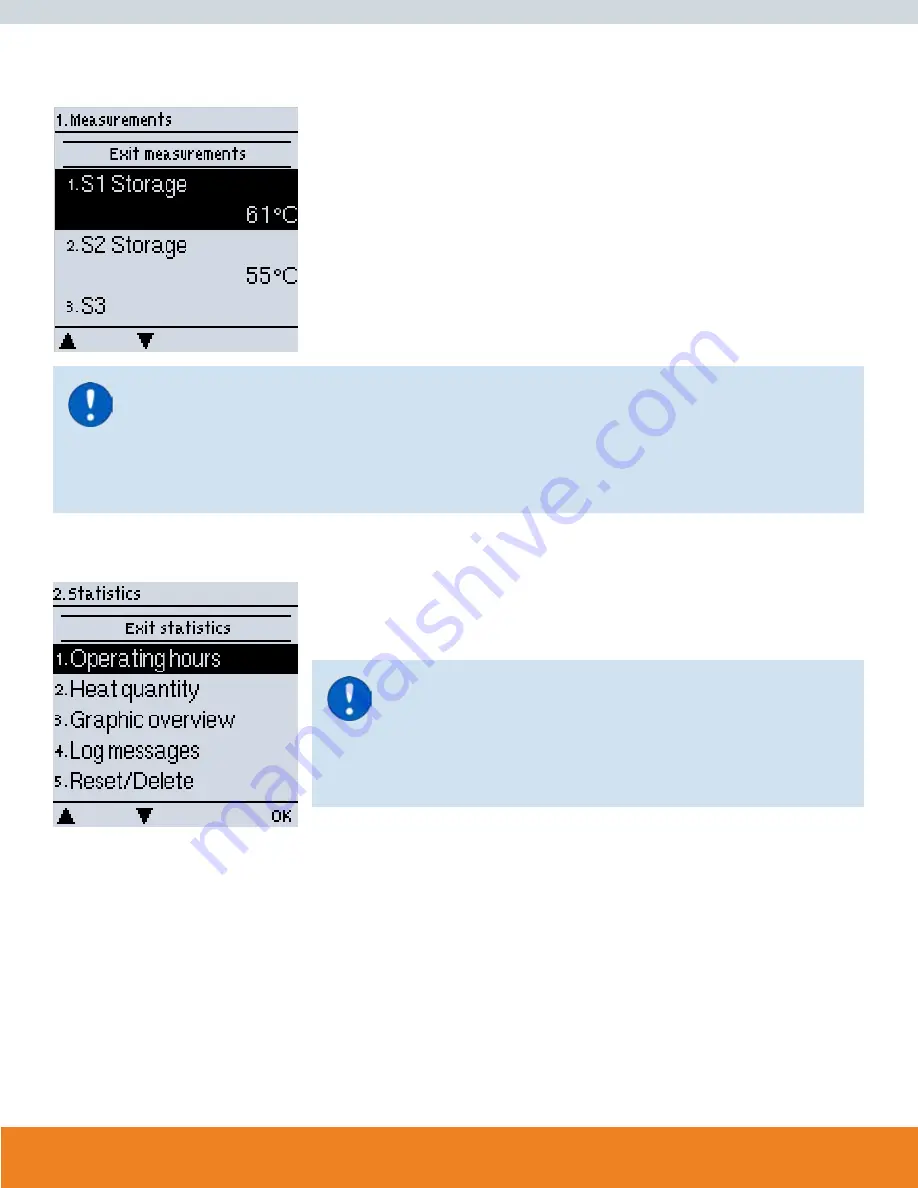
The menu “1. Measurement values” serves to display the currently measured temperatures.
The menu is closed by pressing “esc” or selecting “Exit measurement values”.
Selecting “Overview” or “esc” exits the Info mode.
CAUTION
If “Error” appears on the display instead of the measurement value, then there may be a defective or incorrect temperature
sensor. If the cables are too long or the sensors are not placed optimally, the result may be small deviations in the measurement
values. In this case the display values can be compensated for by making entries on the controller. Follow the instructions under
„6.19. - Sensor calibration“ on page 41. What measurement values are displayed depends on the selected program, the connected
sensors and the specifi c device design.
2. Statistics
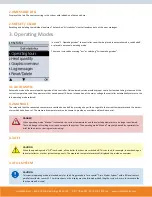
The menu “2. Statistics” is used for function control and long-term monitoring of the system.
The menu is closed by pressing “esc” or selecting “Exit statistics”.
CAUTION
For analysis of the system data it is essential for the time to be set accurately on
the controller. Please note that the clock does not continue to run if the mains
voltage is interrupted, and must therefore be reset. Improper operation or an in
-
correct time may result in data being deleted, recorded incorrectly or overwritten.
The manufacturer accepts no liability for the recorded data!
2.1 OPERATING HOURS
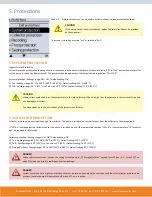
Display of operating hours of the solar pump connected to the controller; various time ranges (day-year) are available.
2.2 HEAT OUTPUT
Display of the heat output of the system.
2.3 GRAPHIC OVERVIEW
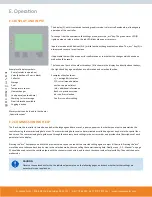
This provides a clearly-organised display of the data listed under 2.1-2.2 as a bar graph. Various time ranges are available for comparison. The two
left-hand keys can be used to page through the data.

