MCPD18 R104
It is not unusual that the operation voltage must be increased several times especially in the
first year of operation.
Typically, the final operation voltage at the end of the burn-in period will be close to the recommended
maximum operation voltage. An increase of the operation voltage above the recommended maximum
operation voltage is in principal possible and allowed, as long as there is no significant increase in the dark
count rate, bright spots at the detection area and/or appearance of high voltage sparking.
The operation voltage can be increased even above the recommended maximum operation
voltage. A safe and reliable operation will still be possible as long as there is no increase in
the dark count rate and/ or no appearance of high voltage sparking.
It can be sufficient to estimate the correct operation voltage by monitoring the detector results, when
increasing the voltage to compensate the gain degradation. The exact operation voltage can always be
determined by measuring a so called MCP curve. The MCP curve plots the detected count rate as a function
of the operation voltage. Do as follows to measure an MCP curve:
Start the detector operation with a homogeneous illumination (as good as possible).
Use an appropriate device to measure the count rate output of the detector.
Decrease the operation voltage until the count rate of the detector is reduced to zero.
Increase the operation voltage in steps of 50V until far above the last operation voltage (please
respect the recommended maximum operation voltage) or until the detector shows significant
artifacts. Measure the count rate for each voltage step.
Plot the measured count rate as a function of the operation voltage. This is the MCP curve. It should
show a change in the slope of the rising curve, which indicates the beginning of the area of operation.
The new value for the operation voltage should be a bit above the position of the change in the slope.
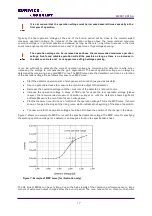
Figure 7 shows an example of a MCP curve with the specified operation voltage. The MCP curve for specifying
the starting operation voltage for a detector can always be found in the specification sheet.
Figure 7: Example of MCP curve (for illustration only).
The life time of MCPs can be very large, due to the high stability of the operation performance over a large
amount of extracted output charges after the burn-in period. The main reason for an often much shorter
17


