SVAN 948 USER MANUAL
.
3 - 20
3.3. INITIAL SETUP OF THE INSTRUMENT
The instrument passes the self-test after switching on (in this time the producer and the name of
the instrument is displayed on the display) and then it enters the sound or vibration mode for channel 1
(depending on which mode was used during the switch off of the unit). The default display mode for
result’s presentation is one profile (see Chapter 4 for details).
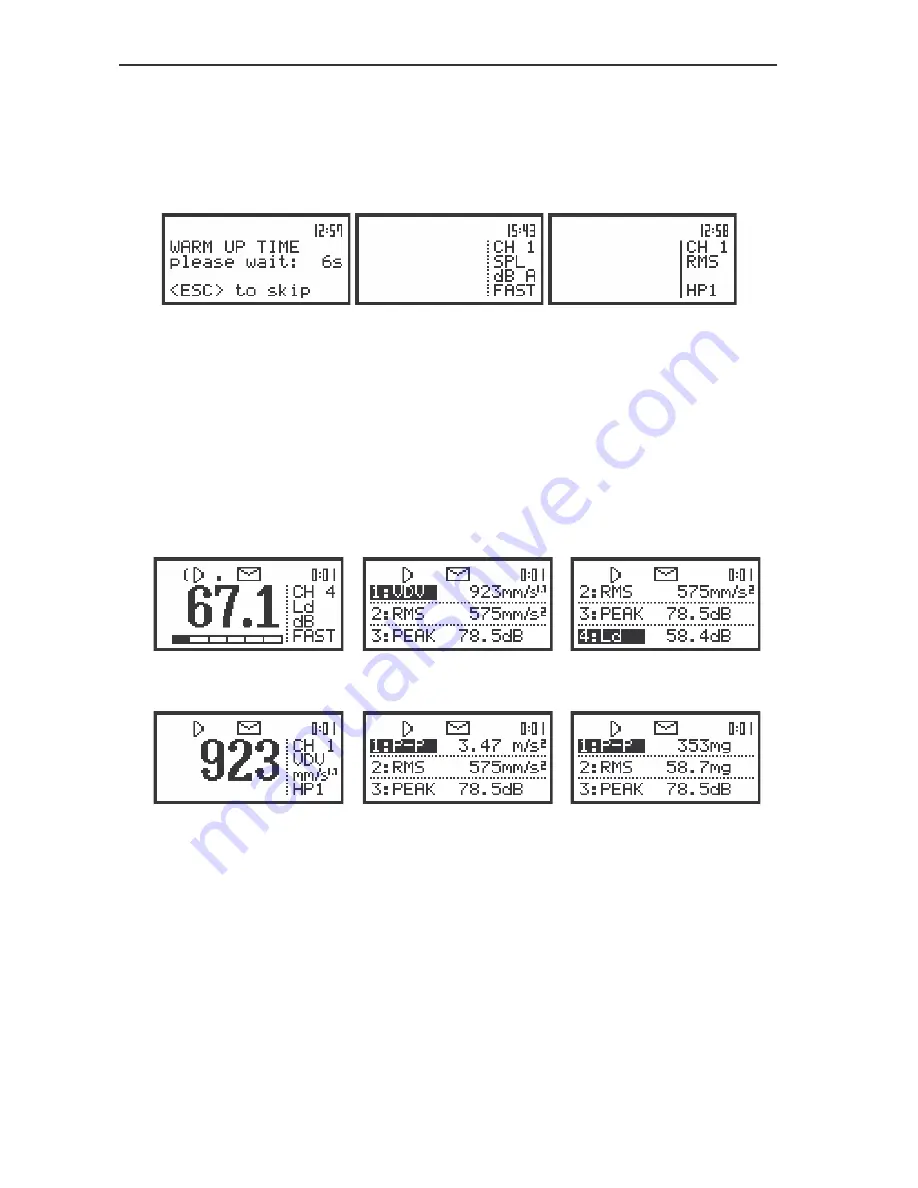
The view of the displays after switching on the instrument
To start the measurements the user has to press
<START /STOP
> push-button. The result of the
measurement is displayed, in so-called one profile mode, using well visible big characters. Under the
result the analogue-like indicator is presented. On the left side of the display, the channel from which
comes the measurement (
CH 1
,
CH 2, CH 3
or
CH 4
), the function name (
SPL
,
LEQ
,
SEL
,
Ld, Ltm3
,
Ltm5
,
Lxx
,
PEAK
,
MAX
or
MIN
in the case of sound measurements and
RMS
,
VDV
,
PEAK
,
P–P
or
MTVV
in the case of vibration measurements), in the case of sound measurement in the third line the unit
of the measurement with weighted filter (
dB
for
LIN
filter,
dB A
for
A
filter,
dB C
for
C
filter or
dB G
for
G
filter) and in the fourth line – the detector time constant (
IMP.
,
FAST
or
SLOW
) are presented. In the case
of vibration measurements in the fourth line the type of the weighted filter selected in a channel is
displayed (
HP1
,
HP3
,
HP10
,
Vel1
,
Vel3
,
Vel10
,
VelMF
,
Dil1
,
Dil3
,
Dil10
,
W–Bxy
,
W–Bz
,
H–A
,
W-Bc
,
KB
,
W
k
,
W
d
,
W
c
or
W
j
).
a)
b)
c)
The view of the display in one profile (a) and 3 PROFILES display mode (b), (c)
a)
b)
c)
The view of the display in one profile (a) and 3 PROFILES display mode with the vibration
measurement (channel 1 and 2) results expressed in METRIC (b) and NON-METRIC units (c)
The results of the measurements can be presented in one profile, in
3 PROFILES
, in
STATISTICS
and in
PLOT
(these are the available display modes set by the producer; cf. the description of the
DISPLAY MODES
sub-list of the
DISPLAY
list). It is possible to change the display mode pressing the
<
>
or
<
>
push-buttons together with the
<SHIFT>
one. In so-called
3 PROFILES
display mode the
results of the measurement from all channels are displayed simultaneously. The units, weighted filter and
detector time constant are also shown. The default settings (set up by the producer) for the channels, in
the case of sound measurements, are as follows:
CHANNEL 1
-
VIBR.
mode;
316 m/s
2
range;
HP1
weighting filter (
FILTER: HP1
),
1.0 s
RMS detector
(
DETECT.: 1.0s
);
CHANNEL 2
-
VIBR.
mode;
316 m/s
2
range;
HP3
weighting filter (
FILTER: HP3
),
1.0 s
RMS detector
(
DETECT.: 1.0s
);
Summary of Contents for SVAN 948
Page 1: ...SVAN 948 SOUND AND VIBRATION DATA LOGGER USER S MANUAL SVANTEK Sp z o o WARSAW June 2004...
Page 19: ...SVAN 948 USER MANUAL 2 6 The view of the rear panel of the SVAN 948 instrument in 1 1 scale...
Page 25: ...SVAN 948 USER MANUAL 3 6 Control diagram of the INPUT list...
Page 28: ...SVAN 948 USER MANUAL 3 9 Control diagram of the DISPLAY list...
Page 30: ...SVAN 948 USER MANUAL 3 11 Control diagram of the FILE list...
Page 32: ...SVAN 948 USER MANUAL 3 13 Control diagram of the AUX FUNCTION list...
Page 36: ...SVAN 948 USER MANUAL 3 17...
Page 37: ...SVAN 948 USER MANUAL 3 18 Control diagram of the SETUP list...


