DHR/AR Series SALS Accessory Getting Started Guide
Page 28
10
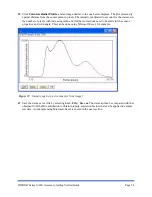
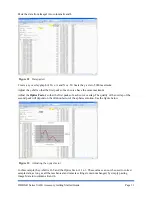
Click
Calculate Radial Profile
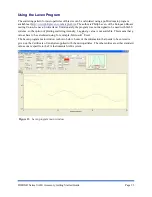
, and an image similar to the one below displays. The plot is intensity
against distance from the center point, in pixels. The intensity is adjusted to account for the increase in
the number of pixels with increasing radius, but further corrections need to be made for the sensor
properties and solid angle. This can be done using Microsoft Excel, for example.
Figure 19
Intensity against pixel radius plot from ImageJ
11
Save the data as a text file by selecting
List
>
File
>
Save as
. The data can then be compared with that
obtained from the Mie calculation to obtain intensity correction factors that can be applied to sample
test data. An example using Microsoft Excel is shown in the next section.


