background image

DHR/AR Series SALS Accessory Getting Started Guide

Page 25

Preparing and Loading the Calibration Sample

Follow steps 1 to 12 of the alignment procedure, lock the camera exposure, and then capture the image. To 
improve the data quality, it is best to record several images at this point, for later averaging. An oscillatory 
time sweep at the minimum stress in continuous controlled stress mode is suitable for this task.

Once the Mie scattering images have been recorded, a background image of purified water should be 
recorded, which will later be subtracted from the Mie scattering image. Raise the instrument head and 
remove the sample of spheres, clean the upper and lower plates, and replace the sample with two or three 
drops of purified water. Close the geometry gap to 1000 µm, and record the image (as with the Mie scatter-
ing images, it is best to record several images for later averaging). It is critical that the focussing and cam-
era exposure are not adjusted between recording the Mie and water images. To prepare images for 
manipulation, load the results files into the Data Analysis package and export the images.

Manipulation of the measured images can be done using a program such as ImageJ, a public domain Java 
image processing program available at 

http://rsb.info.nih.gov/ij/

. The plug-in Radial Profile Angle should 

also be downloaded. 

Using ImageJ

Follow these steps:

1

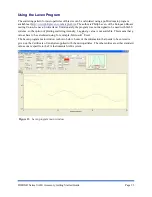
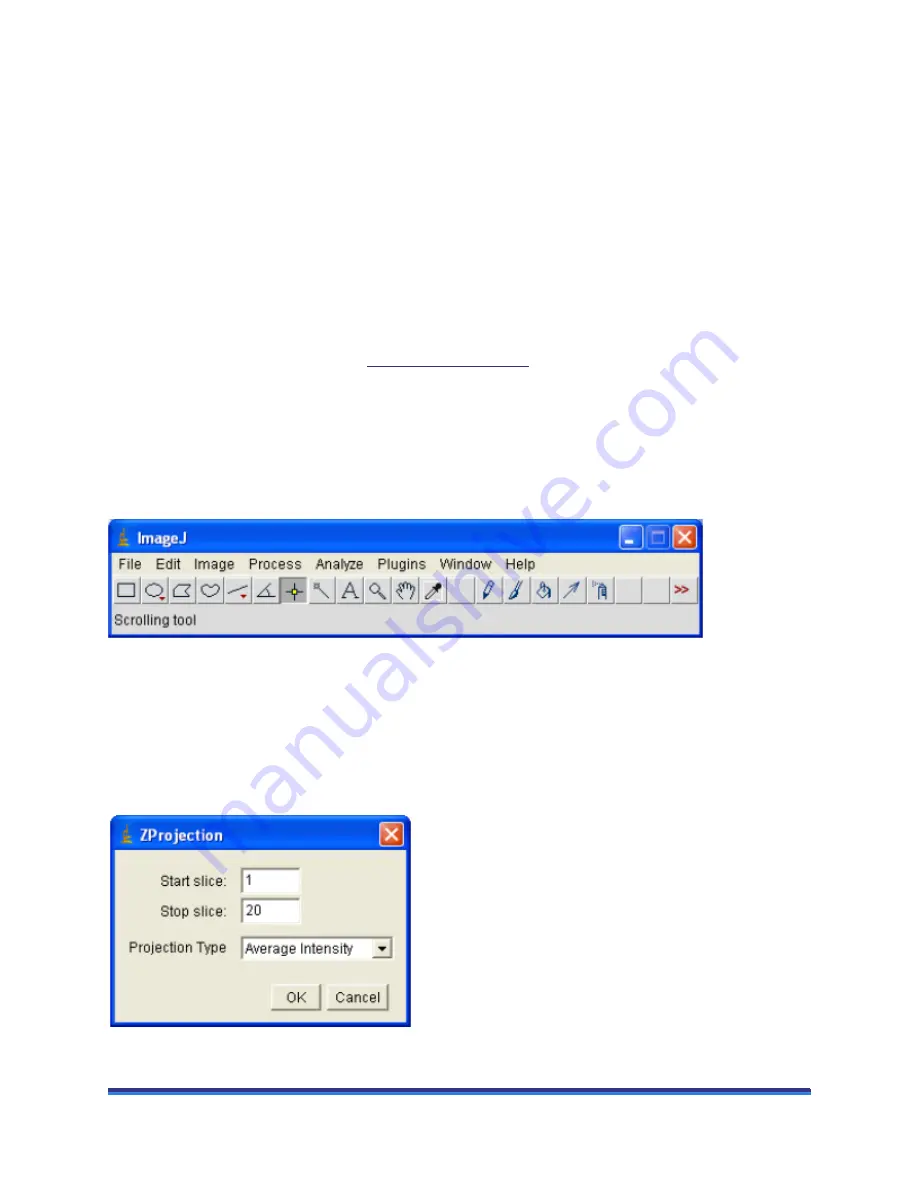
Start ImageJ. The program main window appears. 

 Figure 14 

ImageJ main window.

2

Choose 

File 

Open

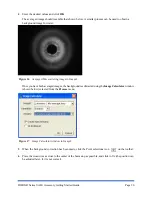
. Navigate to where the Mie scattering files are and open them. 

3

Select 

Image 

Stacks 

Convert Images to Stack

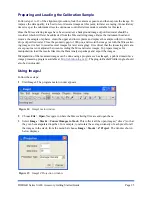
. This collects all the open images (“slices”) so that 

they can be manipulated together. For example, to calculate the average intensity of each pixel for all 
the images in the stack, from the menu bar choose 

Image 

Stacks 

Z Project

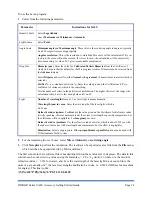
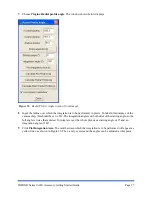
. The window shown 

below displays. 

 Figure 15 

ImageJ ZProjection window.

Summary of Contents for DHR Series

Page 1: ...Revision G Issued November 2013 Getting Started Guide DHR Series and AR Series Small Angle Light Scattering SALS Accessory...

Page 2: ...overing subject matter in this document Except as expressly provided in written license agreement from TA Instruments the furnishing of this document does not give you any license to these patents tra...

Page 3: ...ruments Manual Supplement Please click the TA Manual Supplement link to access the following important information supplemental to this Getting Started Guide TA Instruments Trademarks TA Instruments P...

Page 4: ...2 No 61010 2 010 Particular requirements for laboratory equipment for the heating of materials For European Economic Area In accordance with Council Directive 2006 95 EC of 12 December 2006 on the har...

Page 5: ...Generators For the European Economic Area In accordance with Council Directive 2004 108 EC of 15 December 2004 on the approximation of the laws of the Member States relating to electromagnetic compati...

Page 6: ...ce and repair of internal parts must be performed only by TA Instruments or other qualified service personnel AVERTISSEMENT Pr sence de tensions lev es dans cet instrument La maintenance et la r parat...

Page 7: ...f the instrument This manual is intended to be used in conjunction with the DHR Getting Started Guide and the AR G2 AR 2000ex AR 1500ex Rheometer Getting Started Guide For full details on the operatio...

Page 8: ...Plane of Focus 13 Polarization 14 Intensity Adjustment 14 Intensity Corrections 14 Specifications 15 Chapter 2 Installing the SALS Accessory 16 Installing the SALS Accessory 16 Mounting the Upper and...

Page 9: ...Accessory Getting Started Guide Page 9 Chapter 4 Using the SALS Accessory 32 Overview 32 Loading the Sample 32 Setting the Focal Position 33 Locking Exposure 33 Selecting the Image Format 33 Exporting...

Page 10: ...allows the laser to be trained on the sample The resultant scattered light is transmitted through the upper transparent quartz geometry and is observed by a lens and camera assembly The camera images...

Page 11: ...d for Bragg s law is half the angle defined for SALS by convention the symbol is used rather than for Bragg s law but in this context that would be confusing So L 2 sin 2 sin 2 So L 2 q Thus the great...

Page 12: ...1024 pixel size 5 2 m square Figure 4 SALS Accessory components Figure 4 above provides a schematic of the SALS accessory components A schematic of the optical sys tem is shown in Figure 5 The pinhol...

Page 13: ...ich the deflection through 90 is ignored this does not affect principle of the optical system Figure 6 Simplified view of the SALS optics The maximum scattering angle will also depend on the position...

Page 14: ...for level 3 experiments see Chapter 3 The scattered light falls on a flat sensor consisting of an array of pixels The absolute intensity of the light Iabs is obtained from the intensity reported by t...

Page 15: ...ng Angle 6 to 26 8 Laser 635nm 0 95mW class 2 Peltier Temperature Controlled 5 to 95 C WARNING The upper temperature limit is set by the optical adhesive that retains the sapphire window Do no exceed...

Page 16: ...l 2 Attach the upper fixture to the mounting ring on the underside of the instrument head using the three captive screws provided NOTE The camera should project to the right of the instrument when vie...

Page 17: ...g in the camera USB cable 1 Download the LuCam Software V6 0 3 or higher from the link below http www lumenera com support downloads industrial downloads php 2 Run the downloadable executable LuCamSof...

Page 18: ...diminish in intensity as the scattering angle increases Mie scattering Polystyrene micro particles of nominal diameter 3 m are suitable for this purpose and these can be obtained from Sigma Aldrich Fl...

Page 19: ...lower fixture See Figure 10 below Figure 10 Removing the filter 9 Place two or three drops of the alignment solution on the window in the Peltier Plate 10 Turn on the bearing lock and close the geomet...

Page 20: ...he below right image Figure 11 Swivel mount NOTE It may be necessary to adjust the camera settings such as exposure brightness and contrast by accessing the Camera properties on the camera setup scree...

Page 21: ...xperiment will determine the choice of format Level 1 Experiments Images can be collected together with the rheological data and viewed in the Data Analysis package Images can be collected in JPEG for...

Page 22: ...ut variables such as the lens and sensor positions are not known sufficiently precisely to make this a reliable way of determining that relationship Mie Scattering A more accurate method of obtaining...

Page 23: ...nately the program was not designed to be used with SALS systems so the option of plotting scattering intensity I against q value is not available This means that q values have to be calculated using...

Page 24: ...l not be smooth If it is set too low the calculation will be excessively time consuming A value of 0 1 gives a reasonable compromise Drop Size Diameter m Enter the value for Calibrated Particle Diamet...

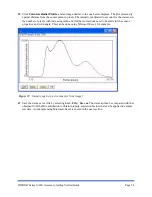
Page 25: ...t is best to record several images for later averaging It is critical that the focussing and cam era exposure are not adjusted between recording the Mie and water images To prepare images for manipula...

Page 26: ...ering image in ImageJ Once you have both averaged images the background is subtracted using the Image Calculator window shown below selected from the Process menu Figure 17 Image Calculator window in...

Page 27: ...ke full advantage of the camera chip this should be set to 512 The integration angle is on both sides of the starting angle so the full angle is twice that entered To integrate over the whole plot use...

Page 28: ...ith increasing radius but further corrections need to be made for the sensor properties and solid angle This can be done using Microsoft Excel for example Figure 19 Intensity against pixel radius plot...

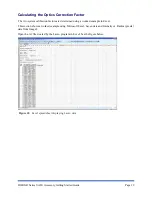
Page 29: ...m calibration factors are determined using a worked example in Excel This section shows a worked example using Microsoft Excel Laven data and Intensity vs Radius pixels date from ImageJ Open the txt f...

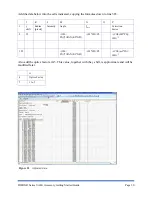
Page 30: ...Also add the optics factor at G5 This value together with the y shift is approximate and will be modified later Figure 21 Adjusted data J K L M N O P 1 y shift Radius pixels Intensity Angle Icorr Cor...

Page 31: ...maximum Adjust the Optics Factor so that the first peaks of each curve overlap The quality of the overlap of the second peak will depend on the dilution factor of the spheres solution See the figure...

Page 32: ...sam ple to the edge of the upper plate But it is important when performing a SALS experiment that there are no entrained bubbles in the sample as these will tend to disrupt the scattering pattern Unfo...

Page 33: ...e adjustable front lens posi tions taken from the scale Locking Exposure Exposure as well as other camera settings are made by accessing the camera Settings on the Image panel in TRIOS Help Selecting...

Page 34: ...ng 25 instrument symbols 6 L license agreement 3 loading the sample 32 locking exposure 33 N notes 4 P patents 3 R Regulatory Compliance 4 S safety 6 instrument symbols 6 Safety Standards 4 SALS align...

Page 35: ...arted Guide Page 35 preparing and loading calibration sample 25 product description 12 setting the focal position 33 specs 15 using 32 scattering theory 10 setting the focal position 33 T TA Instrumen...

Reviews: