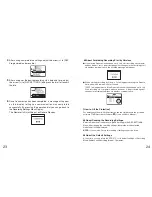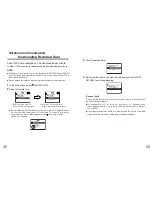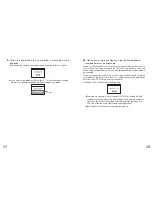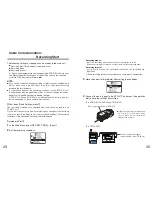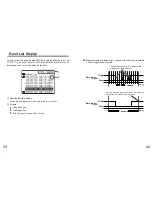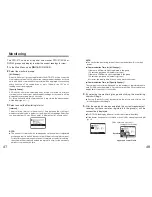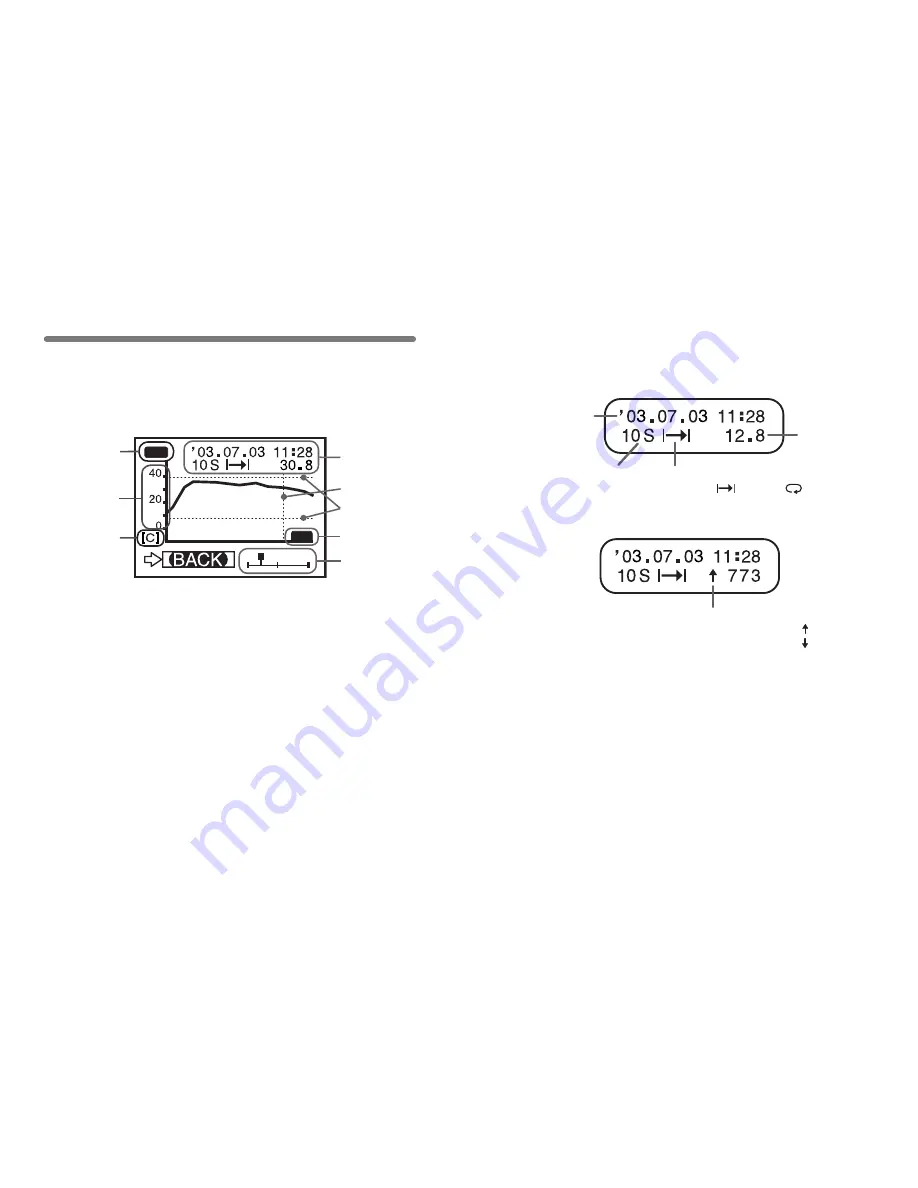
①
Displayed Channel
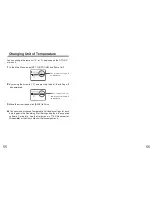
If there is recorded data in two channels, by holding in the operation dial
for more than 1.5 seconds the channel will change.
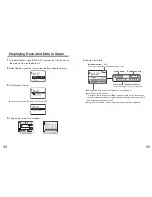
②
Scale
If you want to set the temperature display unit for Fahrenheit (
゜
F
),
open [SET FUNCTIONS]-[Temp Unit C/F].
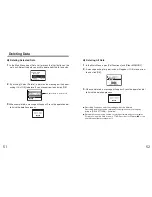
③
Vertical Axis Unit
[C] : Celsius, [F] : Fahrenheit, [%] : Humidity, [V] : Voltage, [P] : Pulse
37
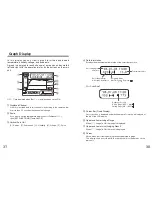
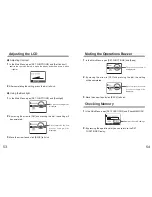
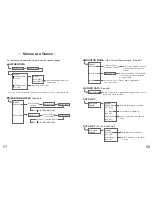
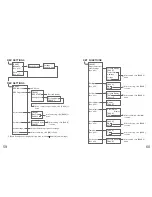
In this display you can view in graph form the downloaded
temperature, humidity, voltage, and pulse data.
A graph is displayed for each channel of data and can be scrolled
left and right with the operation dial or by the buttons on the main
unit.
※⑥・⑦
are displayed when [Set
↑↓
Limits] has been set as ON.
Graph Display
OK
CH1
①
②
④
③
⑤
⑦
⑧
⑥
38
⑤
Cursor Bar (Fixed Display)
Cursor position is displayed and measurement information is displayed at
the top of the LCD display.
⑥
Upper and Lower Judge Range
When [
↑↓
Judge] is ON, the range is displayed.
⑦
Upper and Lower Limit Judging Result
When [
↑↓
Judge] is ON, the result is displayed.
⑧
Cursor
Shows which part of entire data is presently displayed in graph.
The display can be scrolled with the operation dial or the buttons on the
main unit.
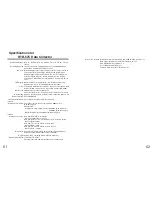
Recording Date
and Time
Recording Interval
S:Seconds M: Minutes
Recording Mode
One Time:
Endless:
Temperature Unit
④
Data Information
Displays the measurement information of the cursor bar position.
【
For Pulse Data
】
Response Polarity
Rising Edge (OFF
→
ON) :
Falling Edge (ON
→
OFF) :


