39
40
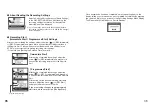
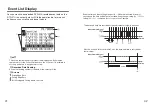
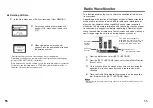
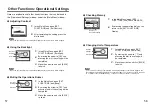
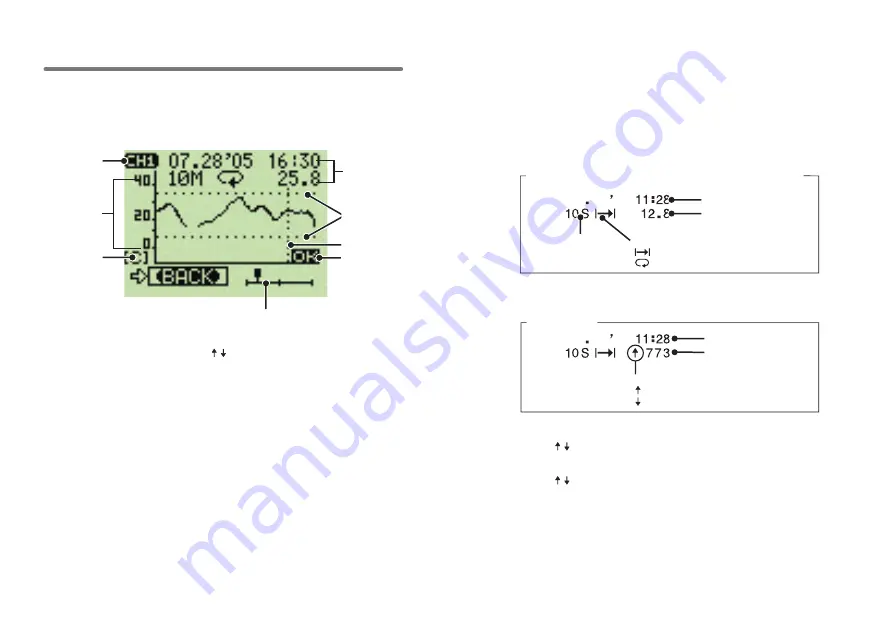
Graph Display
In this display you can view in graph form the downloaded
Temperature, Humidity, Soil Moisture, Voltage and Pulse data. A
graph is displayed for each channel of data and can be scrolled left
and right with the operation dial or by the buttons on the main unit.
①
②
③
④
⑥
⑦
⑧
⑤
※⑦・⑧
are displayed when [Set
Limits] has been set as ON.
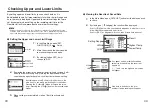
①
Displayed Channel
If there is recorded data in two channels, by holding in the operation dial
for more than
1
.
5
seconds the channel will change.
②
Scale
The scale's vertical axis will display temperature, humidity, soil moisture
and pulse . The horizontal axis displays time.
③
Vertical Axis Unit
[F] : Fahrenheit [C] : Celsius [%] : Humidity and soil moisture
[V] : Voltage [P] : Pulse
・
If you want to set the temperature display unit for Celsius
(
℃
), open
[SET FUNCTIONS]-
[Temp Unit C/F].
④
Cursor
Shows which part of entire data is presently displayed in graph.
The display can be scrolled with the operation dial or the buttons on the
main unit.
⑤
Cursor Bar (Fixed Display)
Cursor position is displayed and measurement information is displayed
at the top of the LCD display.
⑥
Data Information
Displays the measurement information of the cursor bar position.
05
07 31
05
07 31
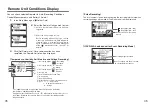
Recording Interval
S:Seconds
M: Minutes
Recording Mode
:
OneTime
:
Endless
Response Polarity
:
Rising Edge (OFF
→
ON)
:
Falling Edge (ON
→
OFF)
Recording Date and Time
Measurment Value
(
For Recording Interval and Recording Mode details, see p.
27
)
Display Examples:
Temperature, Humidity, Soil Moisture and Voltage Data
Pulse Data
Recording Date and Time
Measurment Value
⑦
Upper and Lower Judging Range
When [
Judge] is ON, the range is displayed.
⑧
Upper and Lower Limit Judging Result
When [
Judge] is ON, the result is displayed.
If set for [ON], data will be checked and judged as to whether or not it
falls within the set upper and lower limits.
If set for [OFF], no judgment will occur, even if limits have been set.


