38
Graph Tools Program
This part of the software allows you to read the downloaded data to create
graphs and tables for display or for printing. It also enables you to create text
type files for use with spreadsheet applications.
1
. Explanation of Display
●
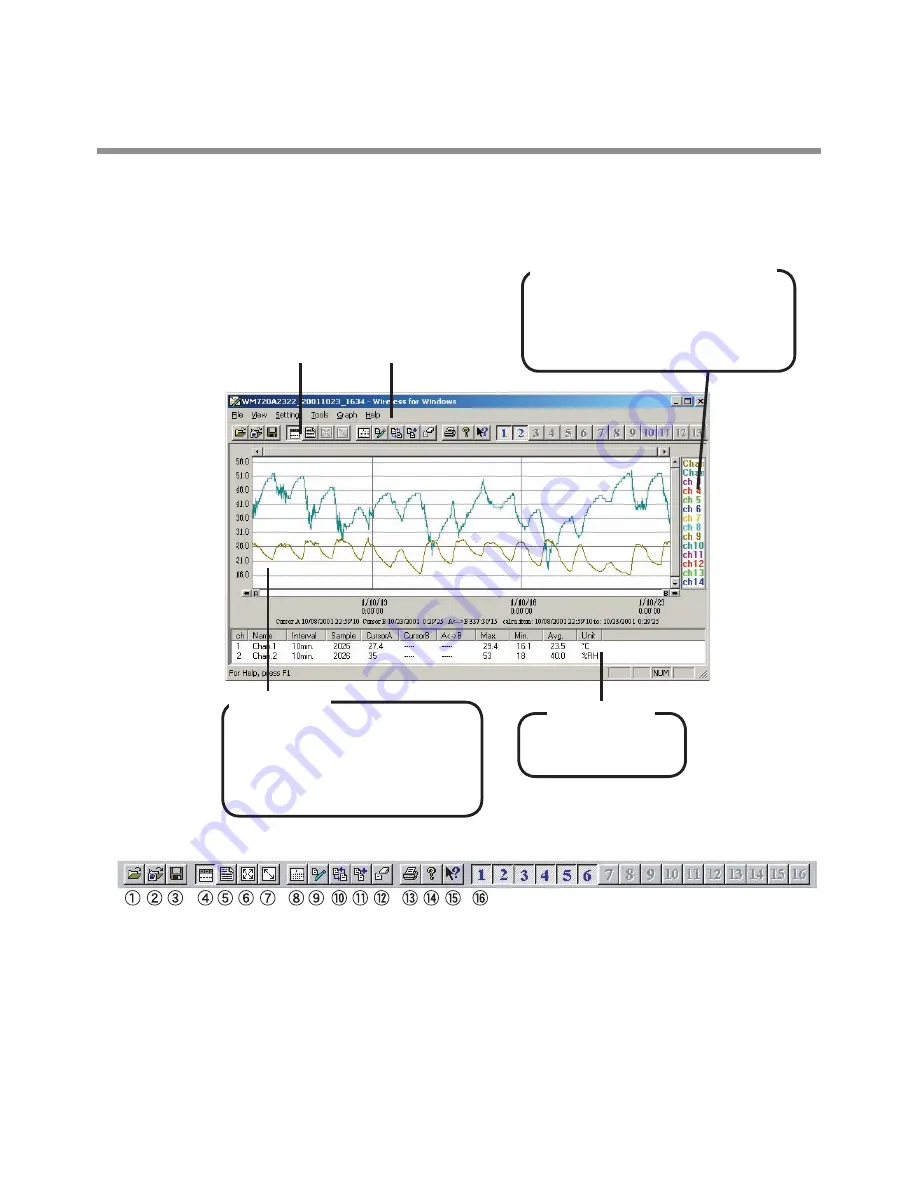
Toolbar
①
Open Data File
②
Open File from Remote Unit
③
Save
④
Show Channel Info
⑤
Show Data in Table Form
⑥
Undo Zoom
⑦
Fade Zoom to Original Size
⑧
Calculation Range Settings
⑨
Edit Recording Conditions
⑩
Re-order Channels
⑪
Merge Channels
⑫
Delete Channel
⑬
⑭
Help
⑮
About
⑯
Channel Display ON / OFF
Menu
Channel Info
A list of information
for each channel
Toolbar
Channel Name Display Area
By holding down the left mouse
button on this area, the area
will expand to allow you to read
full channel names
Graph Area
The horizontal axis is date/time
and vertical axis is unit of temp
/ humidity . By dragging mouse
across area you can zoom in
on area covered with mouse.


