Temperature/Humidity Graph
48
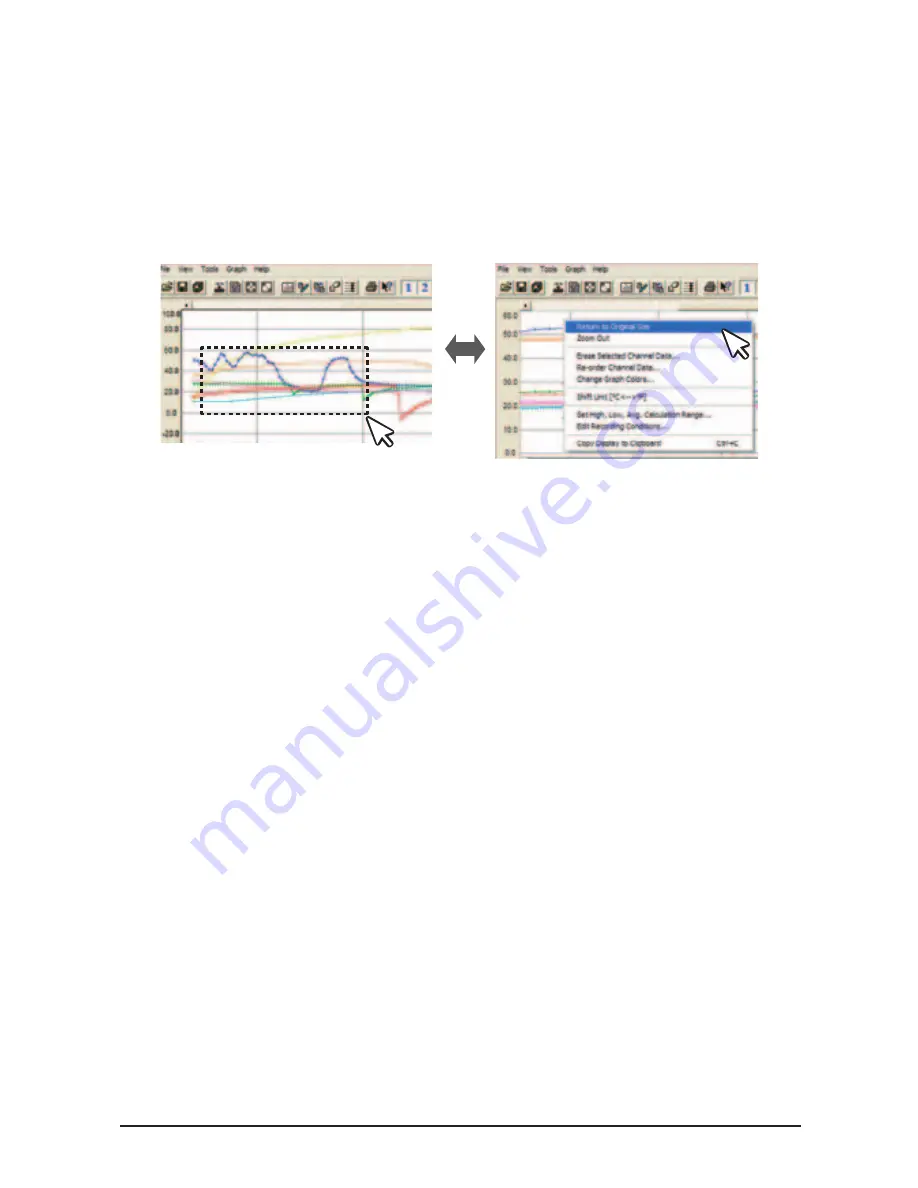
Zooming In and Out on the Graph
With the left button drag the mouse to outline
the area you want to zoom in on.
With the mouse, right click on the graph and
select [Return to Original Size] in the pop-up
Menu that appears.
〔
Enlarged
〕
〔
Reduce
〕
By right clicking on the graph, the Menu will be displayed. With [Return to Original Size]
or [Step-by Step Return to Original] you can return both the vertical and horizontal axis
back to show the entire graph.
* These operations can be carried out via commands in the [Graph] Menu or by clicking icons in
the Toolbar as above.
- About the Horizontal Axis
The entire graph shows in the horizontal axis the nearest data to the recording start
time and the latest data nearest the recording finish time for each channel
1
-
8
. This
represents the full scale of the horizontal axis.
- About the Vertical Axis
The entire graph shows in the vertical axis the lowest possible measurement value
and the highest possible measurement value for channels
1
-
8
. This represents the
full scale of the vertical axis.
Summary of Contents for TR-5xU Series
Page 22: ...17 Getting Ready...


![Lambrecht Ser[LOG] Operator'S Manual preview](http://thumbs.mh-extra.com/thumbs/lambrecht/ser-log/ser-log_operators-manual_3390951-001.webp)


