12
CLARITY M/CLARITY M STEREO User Manual
Because loudness measuring is based on subjective perception, program
material can overload if normalized using traditional techniques like quasi-peak
or sample-peak. For this reason, normalization has become a part of many
broadcast standards that require a true-peak meter. A true-peak meter looks
at the actual samples as well as inter sample peaks, unveiling peaks that would
otherwise cause distortion.
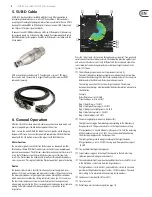
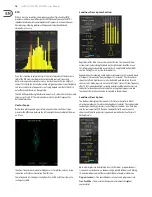
The meters will appear as stereo or 5.1 true-peak depending on the input
selection. Note that the Stereo model does not support 5.1 surround.
Several options are available to customize the function and appearance of the
meter. See Chapter 7 for details.
Channel Measures
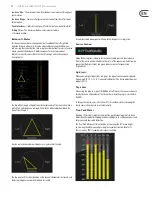
This section has 2 horizontal bar graphs that appear in the lower right corner of
the screen. The upper graph shows the downmix deviation meter, and the lower
shows correlation.
These meters can also be moved to the loudness descriptors column by accessing
the Edit menu and pressing the Layout button (see Chapter 7).
Stereo mixes typically have a very strong mono component. Clarity M simulates
mono downmix (from stereo to mono) as a sum of L and R. Therefore, the mono
downmix deviation of such mixes tend to be 3 dB. Being close to +3 dB
is therefore not considered a problem at all.
Many users will find that the deviation meter is most useful in surround
applications, while the correlation meter is more useful when working with
stereo material.
Deviation
Downmix Deviation shows you how the source performs when downmixed.
This is essential in ensuring your surround mix also sounds good when played
back through stereo speakers. Internally, a behind-the-scenes downmix
is prepared and a comparison between the loudness of your source to the
downmixed version is displayed in the graph. In Stereo mode, we compare the
stereo source to mono (Mono Deviation). In 5.1 mode, we compare the 5.1 source
to stereo (Stereo Deviation). The Stereo model does not support 5.1, so it will only
display stereo-to-mono deviation.
In the Preset Edit menu, select either Short-term or Program to determine the
span (time) used to determine the deviation figure.
Correlation
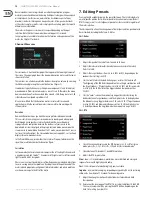
In Stereo mode, the Correlation meter compares the left and right channels with
a single bar graph. In 5.1 mode*
1
, it compares left/right as well as left surround/
right surround with 2 bar graphs.
Phase issues can result in audible loss of low frequencies, unintended alterations
to a mix, among many other problems. Readings toward the positive end of the
meter indicate proper phase alignment (indicated in blue), and phase problems
are shown in orange to the left of the meter.
*The Stereo model does not support surround.
7. Editing Presets
Pressing the 6th encoder brings up the preset Edit menu. The list is divided into
a meter-specific portion that will correspond to the current meter view (Radar/
RTA/V-scope), as well as a list of general parameters that are visible regardless of
the meter selection.
The Edit menu also allows the arrangement of descriptors and true-peak meter to
be customized, including the Balance-O-Meter.
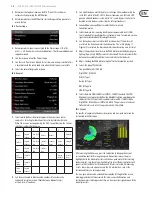
Edit - Radar
1. Adjusts the speed of the radar from 1 minute to 24 hours.
2. Adjusts the radar resolution (distance between each circle in the radar)
from 3 to 12 dB.
3. Adjusts the target loudness from -36 to -6 LUFS or LKFS, depending on the
Loudness Unit setting (see #19).
4. Sets the level at which the loud alert engages, or turns this function off.
The triggering of the LOUD alert depends on this setting in combination with
the Target Loudness. If Target Loudness is set to -24 LUFS and this parameter
is set to 6 LU, the LOUD alert will be triggered when the sound reaches
-18 LUFS.
5. Sets the "zoom" scale on the momentary ring on the radar by setting the
distance between Target Loudness and the highest value to be displayed on
the Momentary ring. Toggles b9 LU and +18 LU. If Target Loudness
is set to -24 LUFS and Momentary Range is set to +18 LU, the highest value
(3 o’clock position on the ring) shown on the momentary ring is 6 LUFS.
Edit - RTA
6. Selects the channels displayed in the RTA. Options are L, R, L+R for stereo
mode, plus L+R+C, C, Ls, Rs, Ls+Rs, LFE, and ALL for surround mode*.
7. Selects between 10-band or 31-band RTA resolution.
8. Adjusts the RTA response time:
Slow
- shows a 1 second response, providing a more stabilized and averaged
response for use with highly dynamic audio.
Fast
- 125 ms response for monitoring fairly constant audio.
Impulse
- asymmetrical averaging, responding very quickly (35 ms) to increasing
audio, and a slow decay of 1.5 seconds for decreasing audio.
9. Adjusts how long the small peak indicator dashes for each band hold
their position.
10. Determines the level range of the RTA (Y-Axis), adjustable from 10 to 60 dB.
This can set automatically by pressing the AUTO button, depending on the
Auto Scale setting (see item #12).
Summary of Contents for Clarity M
Page 20: ......


