Section 7.0 HMI Introduction
HGA IOM
89
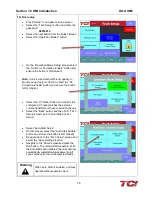
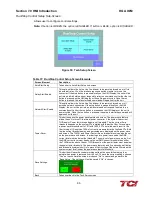
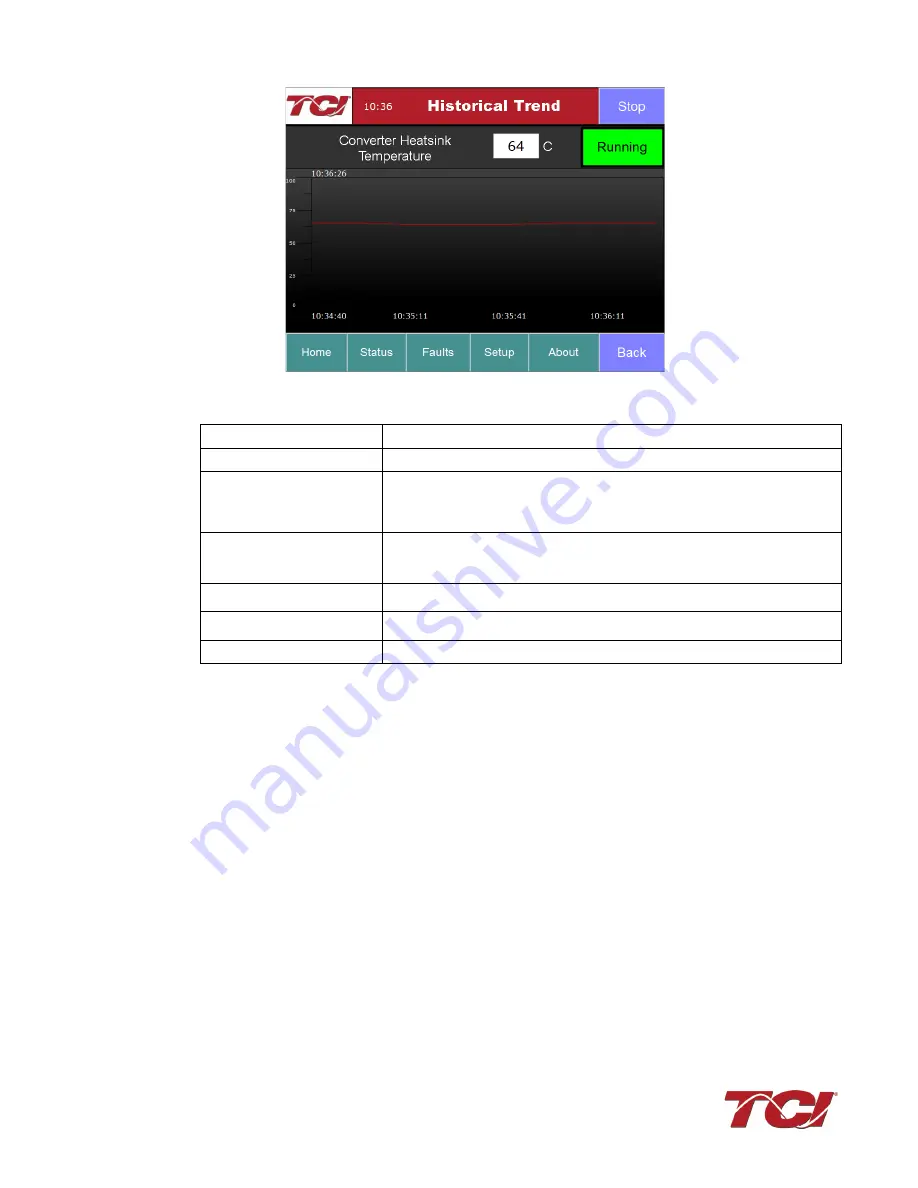
Figure 46: Example Historical Trend Plot Sub Screen
Table 30: Trend Plot Screen Elements
Screen Element
Description
Run/Stop Button
Runs and stops the HarmonicGuard
®
Active filter.
Plot Scale Display
(located on the left side of the
graph)
Indicates the magnitude of the samples of the trend plot. The scale varies with
each of the trend plots.
Right Timestamp
Indicates the date and time the right-most sample displayed on the screen was
taken.
Left Timestamp
Indicates the date and time the left-most sample displayed on the screen was
taken.
Scroll Bar
Allows the user to scroll through all sample points available in the trend plot data
buffer.
Trend Plot Display
The historical graph of the value being sampled over time.
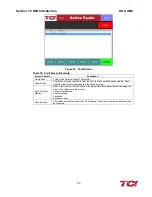
Fault Screen
This button takes the user to the “Active Fault” screen. See figure below, which lists all the active
faults. The faults will stay in this list until the “Reset”, or “Stop” button is pressed or the fault self
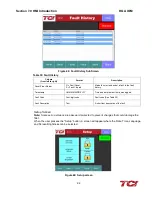
clears. The “Fault History” screen can also be viewed here.


