Operator’s Manual
39
Graphs
The Graphs functions allow you to control the display of several important time and frequency domain
visualizations.
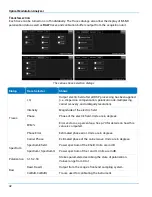
The visualizations are divided into three categories for ease of use: Traces, IQ, and Eyes. Touch the
button to open the configuration dialogs for that category.
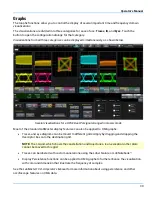
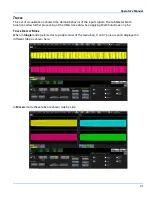
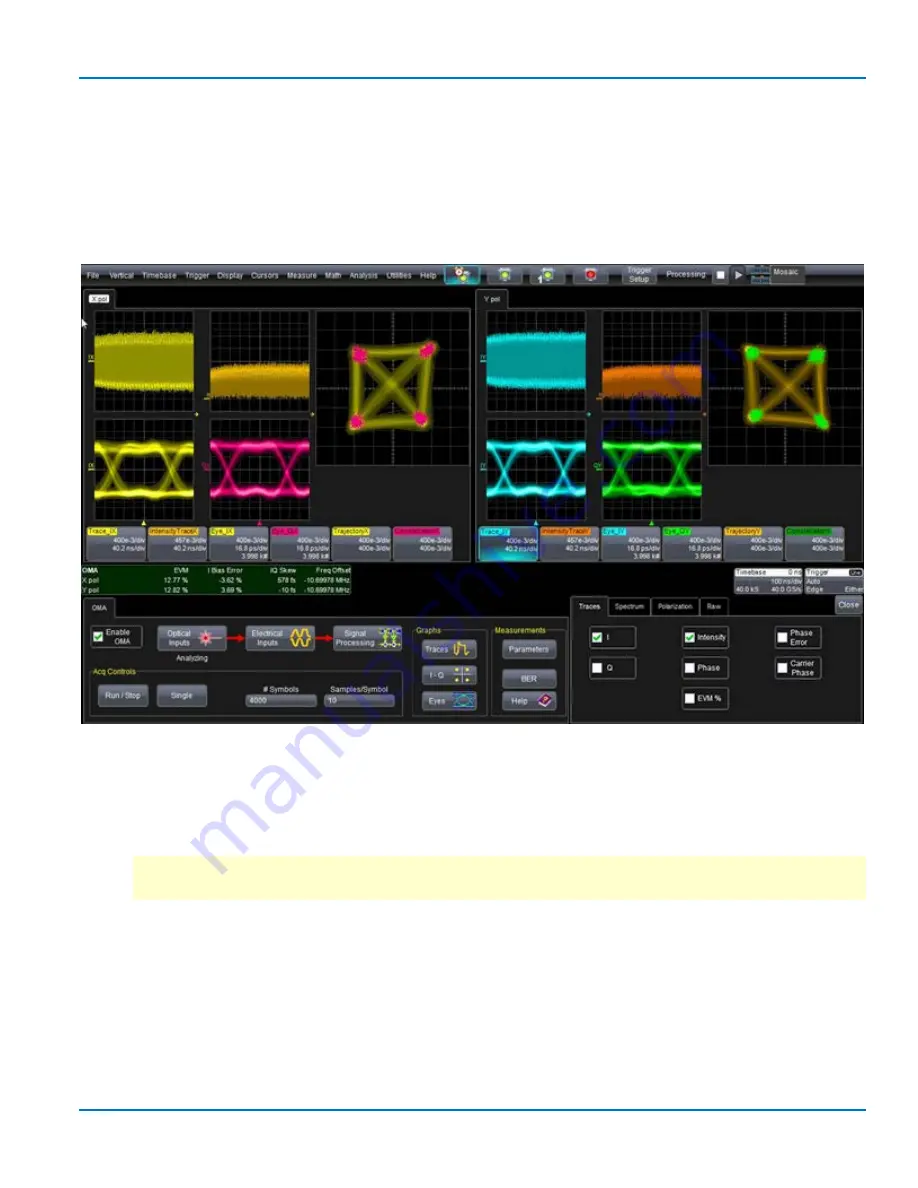
Visualizations from all three categories can be displayed simultaneously, as shown below.
Several visualizations for a QPSK Dual-Pol signal arranged in mosaic mode
Most of the standard LabMaster display features can also be applied to OMA graphs:
•
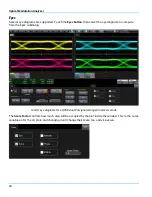
Traces and eye diagrams can be moved to different grids simply by dragging-and-dropping the
descriptor box onto the destination grid.
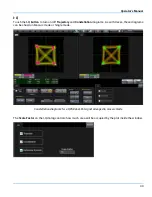
NOTE: The I-Q grid, which shows the constellation and trajectories, is an exception; other plots
cannot be moved to this grid.
•
Traces can be labeled with custom annotations using the Label feature or LabNotebook™.
•
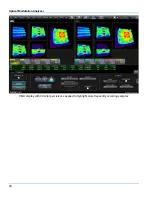
Display Persistence functions can be applied to OMA graphs to further enhance the visualization
with color and dimension that illustrate the frequency of samples.
See the
LabMaster 10 Zi-A Operator’s Manual
for more information about using persistence and other
oscilloscope features on OMA data.
Summary of Contents for IQS25
Page 1: ...Operator s Manual Optical Modulation Analyzer ...
Page 2: ......
Page 3: ...Optical Modulation Analyzer Operator s Manual August 2016 ...
Page 86: ...Optical Modulation Analyzer 78 ...
Page 87: ......
Page 88: ...927295 00 Rev A August 2016 ...


