Optical Modulation Analyzer
42
T
RACE
S
ELECTION
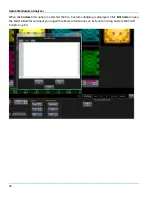
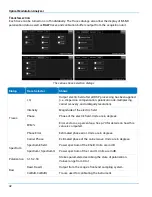
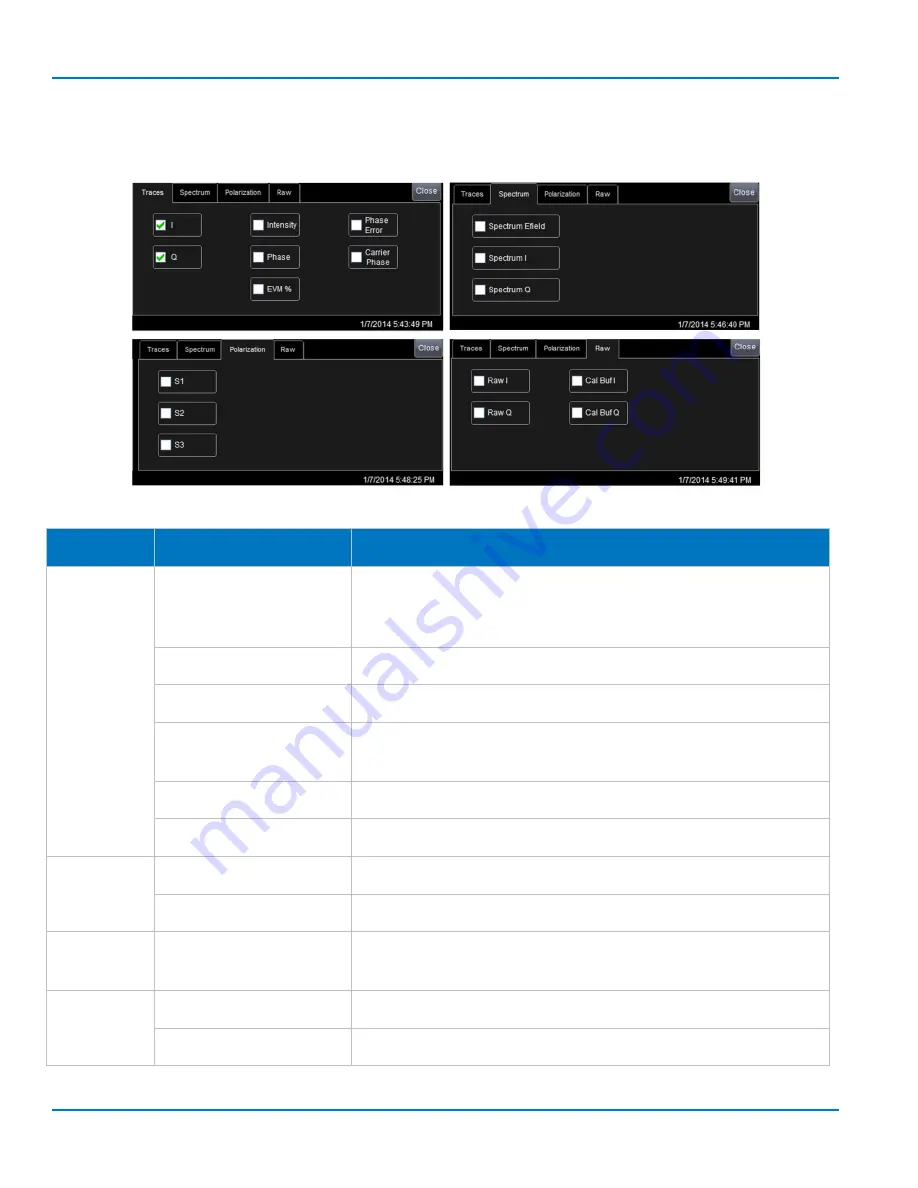
Each trace can be turned on or off individually. The Traces dialogs also allow the display of S1-S3
polarization data as well as RAW traces and calibration buffers output from the acquisition unit.
The various trace selection dialogs
Dialog
Trace Selector
Shows
Traces
I, Q
Output electric field after all DSP processing has been applied
(i.e., dispersion compensation, polarization de-multiplexing,
carrier recovery, and ambiguity resolution).
Intensity
Magnitude of the electric field.
Phase
Phase of the electric field. Units are in degrees.
EVM%
Error vector as a percentage. See p.70 for details on how this
value is computed.
Phase Error
Estimated phase error. Units are in degrees.
Carrier Phase
Estimated phase of the carrier wave. Units are in degrees.
Spectrum
Spectrum Efield
Power spectrum of the Efield. Units are in dB.
SpectrumI, SpectrumQ
Power spectrum of the I and Q. Units are in dB.
Polarization S1, S2, S3
Stokes parameters describing the state of polarization.
Values range from 0 to 1.
Raw
RawI, RawQ
Output from the scope’s front-end sampling system.
CalBufI, CalBufQ
Traces used for calibrating the instrument.
Summary of Contents for IQS25
Page 1: ...Operator s Manual Optical Modulation Analyzer ...
Page 2: ......
Page 3: ...Optical Modulation Analyzer Operator s Manual August 2016 ...
Page 86: ...Optical Modulation Analyzer 78 ...
Page 87: ......
Page 88: ...927295 00 Rev A August 2016 ...


