VUE TZ20-R User Manual
Equipment described herein is subject to US export regulations and may require a license prior to export. Diversion contrary to US law is
prohibited. Imagery for illustration purposes only. Specifications are subject to change without notice. Rev. 100.
© 2021 Teledyne FLIR LLC, Inc. Approved for public release. Teledyne FLIR Approved [FLIRGTC-SBA-007]. All rights reserved.
9
Thermal Studio during post processing. Please refer to https://www.flir.com/discover/suas/uas-radiometric-
temperature-measurements/ for additional information on UAS radiometry.
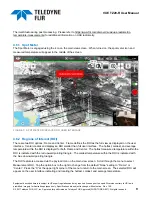
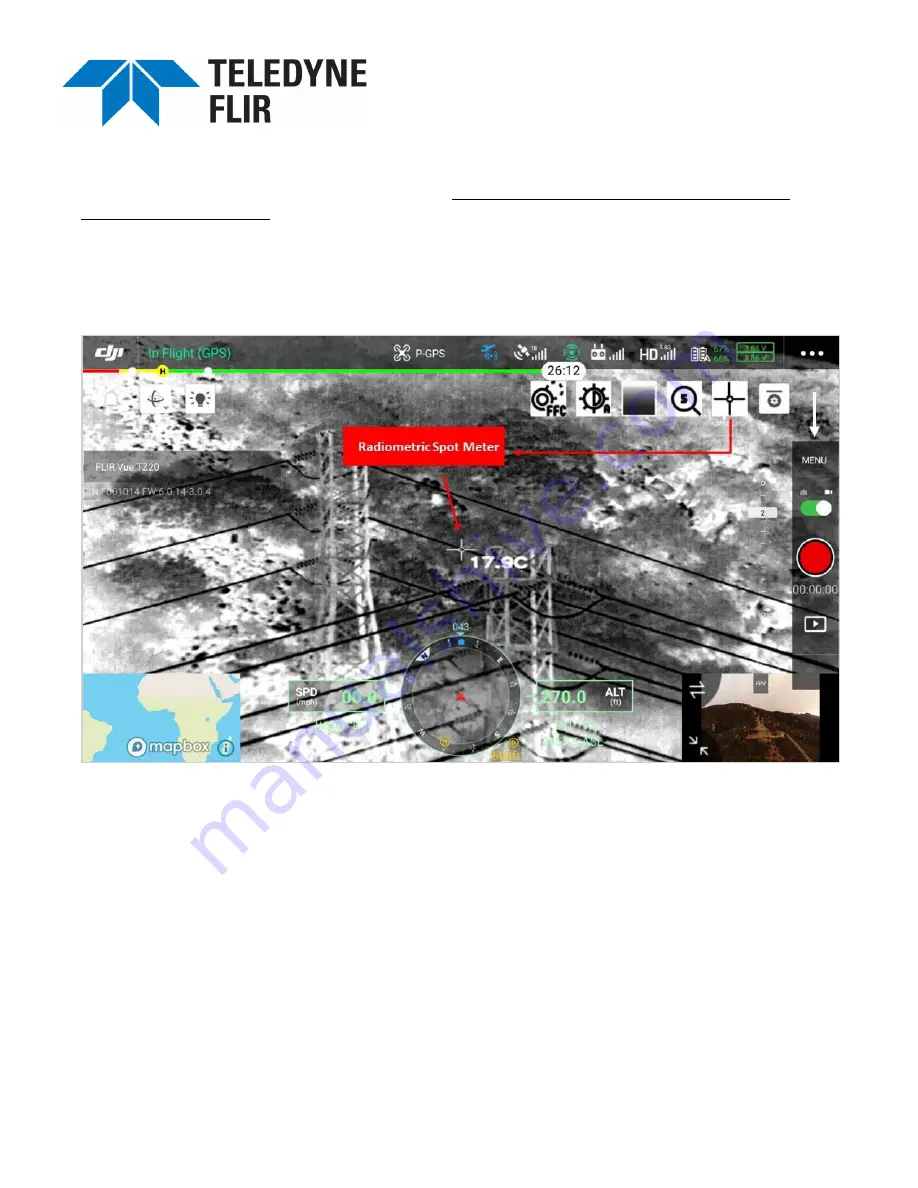
4.6.1 Spot Meter
The Spot Meter is engaged using the icon on the main view screen. When turned on, the spot meter icon and
measured temperature will appear in the middle of the screen.
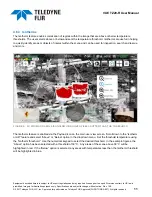
FIGURE 7: SPOT METER DISPLAYED ON USER INTERFACE
4.6.2 Regions of Interest (ROI)
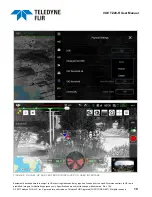
There are two ROI options: Frame and Center. Frame defines the ROI as the full view as displayed on the user
interface. Center creates and displays a ROI smaller than full user interface. The hottest, coldest, and average
temperature within the ROI is displayed for both Frame and Center. The hottest measured temperature within the
ROI is indicated with the red upward pointing triangle. The coldest temperature within the ROI is indicated with
the blue downward pointing triangle.
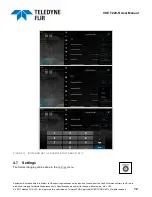
The ROI feature is accessed via the payload icon on the main view screen. Scroll through the menu to select
Measurement ROI. Tap the option box to the right to change from the default “None” setting to “Frame” or
“Center.” Press the “X” at the upper right corner of the menu to return to the main screen. The selected ROI will
appear on the user interface indicating and locating the hottest, coldest, and average temperature.


