3 – Operating software
3-12
© Teledyne Limited
DPN 402197 Issue 7.1
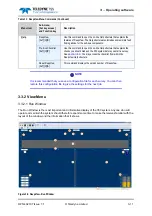
Controls and Features of the Run Window
Controls
❐
The
Title Bar
shows the names of the program and of the window. The right-hand end
includes the standard buttons to minimise, maximise and close the main DeepView window.
❐
The
Menu Bar
includes the five menu headers described under
. To access the
menu and sub-menu commands, click on them or use the appropriate hot-key combination –
[ALT]+[
underlined hot-key character
s]. The Menu Bar also includes buttons to minimise, max-
imise and close the Run Window.
❐
The
DeepView Toolbar
includes the buttons described in
. These tools control
the functions of the DeepView program.
❐
The
Run Window Toolbar
includes the buttons described under
. These tools
control functions within the Run Window only.
Rear Elevation pane
The rear elevation pane is immediately below the Run Window Toolbar and occupies approximately
30% of the area with the window fully maximised. It shows the target
A
as a circle of fixed diameter, a
vertical broken white line
B
that represents the fixed centre-line of the ROV and the two search-coil
triads
C
.
The circle
A
moves horizontally and vertically in the pane as the relative position of the target changes.
The scale
D
provides a visual reference so that you may estimate the vertical distance between the coil
array and the target. CTRL+H switches between 30, 15, 5 and 2 metre vertical display scales.
When the 350 System includes a properly configured altimeter, the top edge
E
of the solid grey area
shows the position of the seabed relative to the coil array. This area expands and contracts vertically
with changes in ROV altitude above the seabed. If the design of the ROV allows you to configure the
350 system with a fixed coil height, the seabed indicator will remain fixed at this altitude.
The Run Window includes a series of data fields that indicate the instantaneous measurements of coil
altitude (ALT)
F
above the seabed, lateral offset (LAT)
G
of the target relative to the centre line, vertical
range to the target (VRT)
H
and target depth of cover (COV)
I
. The 350 system measures VRT and
LAT directly, with positive measurements of LAT representing a starboard offset relative to the centre
line. Measurements of ALT arrive from an altimeter, or represent the fixed coil height if this is
applicable. DeepView calculates the value displayed in the COV field using COV = VRT–ALT so that
positive values indicate a target that is buried. All measurement are in units of centimetres.
The solid white line
J
that separates the rear elevation pane from the ‘snail trail’ pane (described
below) has gradations every 1m or 5m, depending on the swath width.
Two broken red lines
K
extend down the window at ±2m of lateral offset. These show the lateral limits
of a quality control envelope applied by DeepView. To support efficient post-processing on data
acquired by the 350 system, the software sets the quality control flag in the data output when the target
is outside this envelope. Refer to
for a complete description of the quality control features.
‘Snail Trail’ pane
The snail trail pane is immediately below the rear elevation pane and occupies approximately 60% of
the screen area with the window fully maximised. It indicates the lateral offset of the target, relative to
the ROV centre line
B
, for the most recent updates.
Two data panels
L
and
M
show the received signal voltages. In Run mode, the voltages shown are
measured simultaneously on the port vertical (PV), port lateral (PL), port forward (PF), starboard


