3 – Operating software
DPN 402197 Issue 7.1
© Teledyne Limited
3- 13
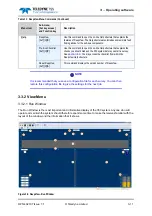
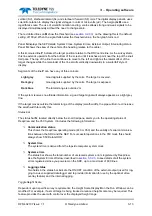
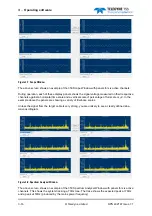
vertical (SV), starboard lateral (SL) and starboard forward (SF) coils. The digital display panel
L
uses
scientific notation to display the signal voltages in units of microvolts (µV). The bargraphs
M
use a
logarithmic scale. The use of scientific notation and log. scales allows strong and weak signals to be
displayed simultaneously without the need to change scale.
The red dotted lines on
M
); on the drawing this is the default
setting of 100µV. When the signal falls below the threshold value, the bargraph turns red.
Panel
N
displays the SEP details, System Clock, System Errors, External Output, Internal log status.
Panel
O
shows the skew of the vehicle (the heading relative to the cable).
A thick coloured line
P
indicates the target position relative to the ROV centre line. As the survey starts,
this line extends upwards from the bottom of the screen until it reaches a point near the top of the snail
trail pane. The top of the line then continues to move to the left and right as the lateral offset of the
target changes while the remainder of the line scrolls vertically downwards in a ‘waterfall’ style of
display.
Segments of the line
P
can have any of three colours:
If the system receives no altitude information, a good target signal will always appears as a light grey
line.
If the target moves outside the lateral range of the display (swath width), the pipe will turn red: increase
the swath width to rectify this.
Status bar
The status bar
N
, located directly below the snail trail pane, alerts you to the operating status of
DeepView and the 350 System. It includes the following information:
❐
Communication status
This shows the DeepView operating mode (440 or 350) and the validity of serial communica-
tions between the SDC and the SEP. For successful operations in the 350 mode this should
always show ‘350 Data GOOD’.
❐
System time
The system time is derived from the topside computer system clock.
❐
System errors
The status bar shows the total number of uncleared system errors registered by DeepView.
Use the System Errors Window, described in
, to see details of all the system
errors registered since you powered-on the SDC, up to a maximum of 600 lines.
❐
Logging status
Two fields in the status bar indicate the ON/OFF condition of the external output (used for log-
ging to a user-supplied data logger and to provide information for use by the optional video
overlay feature) and the internal logging.
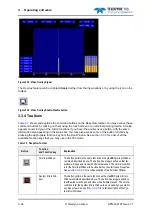
Toggle Height Scale
Dependent upon specific survey requirements, the Height Scale Display
D
on the Run Window can be
modified. For example, if a small target is being tracked a reduced height scale may be required. This
feature provides the user with control over the displayed height range.
Light grey
Good signals supplied by the coils. The target is covered.
Dark grey
Good signals supplied by the coils. The target is exposed.
Dark blue
The lateral range is outside 2m


