RiverPro and RioPro ADCP Guide
October 2017
EAR-Controlled Technology Subject to Restrictions Contained on the Cover Page.
Page 161
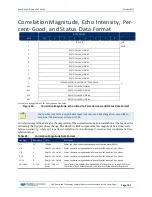
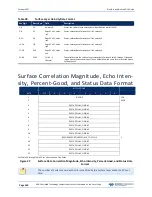
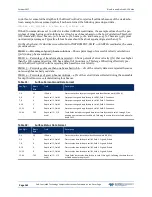
Correlation magnitude data give the magnitude of the normalized echo autocorrelation at the lag used for
estimating the Doppler phase change. The RiverPro/RioPro represents this magnitude by a linear scale
between 0 and 255, where 255 is perfect correlation (i.e., a solid target). A value of zero indicates bad cor-
relation values.
Table 29:
Surface Correlation Magnitude Data Format
Hex Digit
Binary Byte Field
Description
1-4
1,2
ID Code
Stores the surface layer correlation magnitude data identification word (10 02h).
5,6
3
Depth Cell 1, Field 1
Stores correlation magnitude data for depth cell #1, beam #1. See above.
7,8
4
Depth Cell 1, Field 2
Stores correlation magnitude data for depth cell #1, beam #2. See above.
9,10
5
Depth Cell 1, Field 3
Stores correlation magnitude data for depth cell #1, beam #3. See above.
11,12
6
Depth Cell 1, Field 4
Stores correlation magnitude data for depth cell #1, beam #4. See above.
13 – 44
7 – 22
Cells 2 – 5
(if used)
These fields store correlation magnitude data for depth cells 2 through 5 (depending
on measurement conditions) for all four beams. These fields follow the same format
as listed above for depth cell 1.
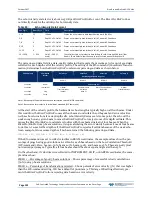
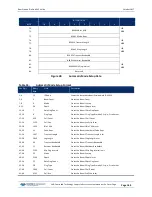
The echo intensity scale factor is about 0.6 dB per RiverPro/RioPro count. The RiverPro/RioPro does not
directly check for the validity of echo intensity data.
Table 30:
Surface Echo Intensity Data Format
Hex Digit
Binary Byte
Field
Description
1 – 4
1,2
ID Code
Stores the surface layer echo intensity data identification word (10 03h).
5,6
3
Depth Cell 1, Field 1
Stores echo intensity data for depth cell #1, beam #1. See above.
7,8
4
Depth Cell 1, Field 2
Stores echo intensity data for depth cell #1, beam #2. See above.
9,10
5
Depth Cell 1, Field 3
Stores echo intensity data for depth cell #1, beam #3. See above.
11,12
6
Depth Cell 1, Field 4
Stores echo intensity data for depth cell #1, beam #4. See above.
13 – 44
7 – 22
Cells 2 – 5 (if used)
These fields store echo intensity data for depth cells 2 through 5 (depending on
measurement conditions) for all four beams. These fields follow the same format as
listed above for depth cell 1.
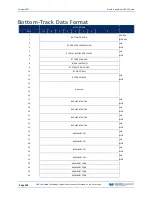
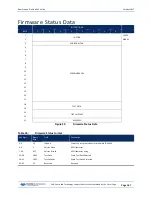
The percent-good data field is a data-quality indicator that reports the percentage (0 to 100) of good data
collected for each depth cell of the velocity profile. The setting of the EX-command (Coordinate Transfor-
mation) determines how the RiverPro/RioPro references percent-good data as shown below.
EX-Command
Coordinate
System
Velocity 1
Velocity 2
Velocity 3
Velocity 4
Percentage Of Good Pings For:
Beam 1
BEAM 2
BEAM 3
BEAM 4
xxx00xxx
Beam
Percentage Of:
xxx01xxx
Instrument
3-Beam
Transformations
(note 1)
Transformations Re-
jected
(note 2)
More Than One Beam
Bad In Bin
4-Beam
Transformations
xxx10xxx
Ship
xxx11xxx
Earth
Note 1. Because profile data did not exceed correlation threshold (
WC command
).
Note 2. Because the error velocity threshold was exceeded (
WE command
).
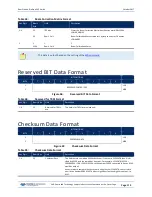
At the start of the velocity profile, the backscatter echo strength is typically high on all four beams. Under
this condition, the RiverPro/RioPro uses all four beams to calculate the orthogonal and error velocities.
As the echo returns from far away depth cells, echo intensity decreases. At some point, the echo will be
weak enough on any given beam to cause the RiverPro/RioPro to reject some of its depth cell data. This
causes the RiverPro/RioPro to calculate velocities with three beams instead of four beams. When the
RiverPro/RioPro does 3-beam solutions, it stops calculating the error velocity because it needs four beams


